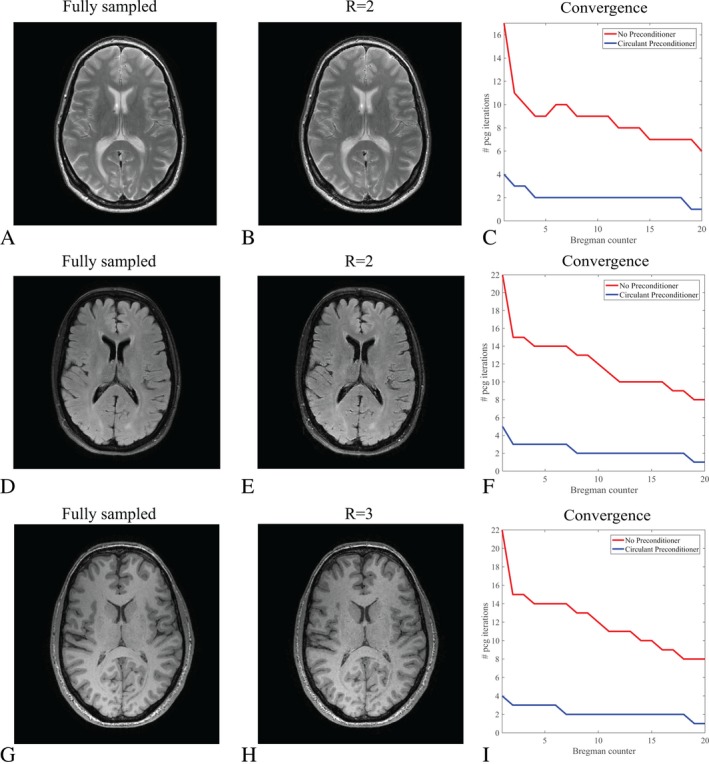
Figure 8.

Reconstruction results for data acquired in fully and undersampled mode. (A) shows a fully sampled scan as a reference for a T2‐weighted TSE scan in the brain, whereas (B) depicts the reconstruction results for a prospectively undersampled scan with an acceleration factor of two (R = 2). The reconstruction matrix has dimensions 256 × 256 and regularization parameters were chosen as , and γ = 1. The convergence results for the PCG part with and without preconditioner are plotted in (C). Results for the FLAIR brain scan are shown in (D)‐(F) for a reconstruction matrix size 240 × 224 and R = 2. Regularization parameters were chosen as , and . Results for a 3D magnetization prepared T1‐weighted TFE scan in the brain are shown in (G)‐(I) for a reconstruction matrix size 240 × 224 and R = 3. Regularization parameters were chosen as , and . Note that the data in the left column stem from a different measurement as the data in the middle column
