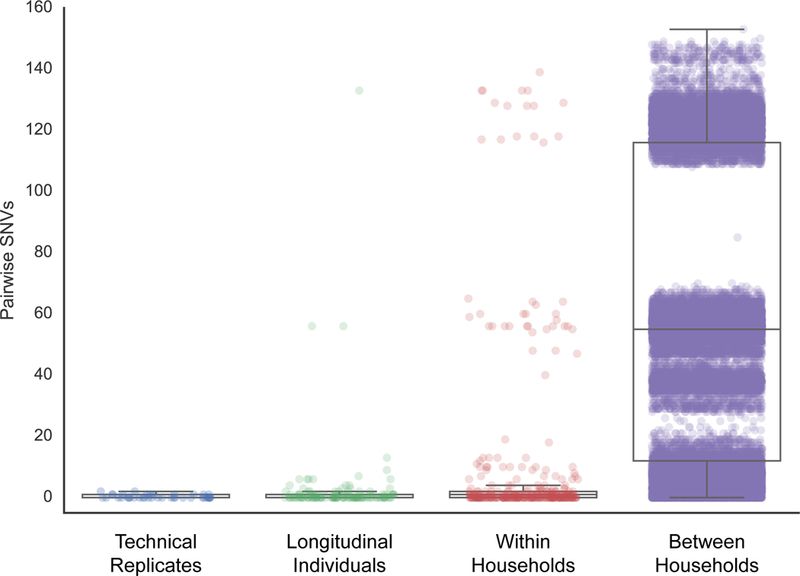
Figure 3. Pairwise comparisons of SNVs within and between households and longitudinal samples.

The technical replicates consist of five colonies that were isolated from a single glycerol stock, which was repeated using four different starting stocks from different individuals. A total of 420 data points represent the pairwise comparisons between the five replicates from each of the four stocks. The longitudinal dataset comprises the 45 individuals sampled at more than one time point. For each individual, we calculated all pairwise comparisons between samples, for a total of 129 data points across all longitudinal individuals. The within household dataset comprises the comparisons within each of the 79 households with more than one individual, for a total of 200 individuals and 339 data points. Only unique person-person samples were compared in this set. The between household dataset includes comparisons between all 102 households within the study, and comprises comparisons across 224 individuals for a total of 39,802 data points. Box plots depict the mean and quartiles for each dataset and the lengths of the whiskers correspond to 1.5 times the interquartile range. Each dot represents the number of SNVs between two isolates and their opacity scales with the number of observations. The apparent tri-modal distributions seen in the plots are due to the underlying population structure of the isolates (see Figure 1).
