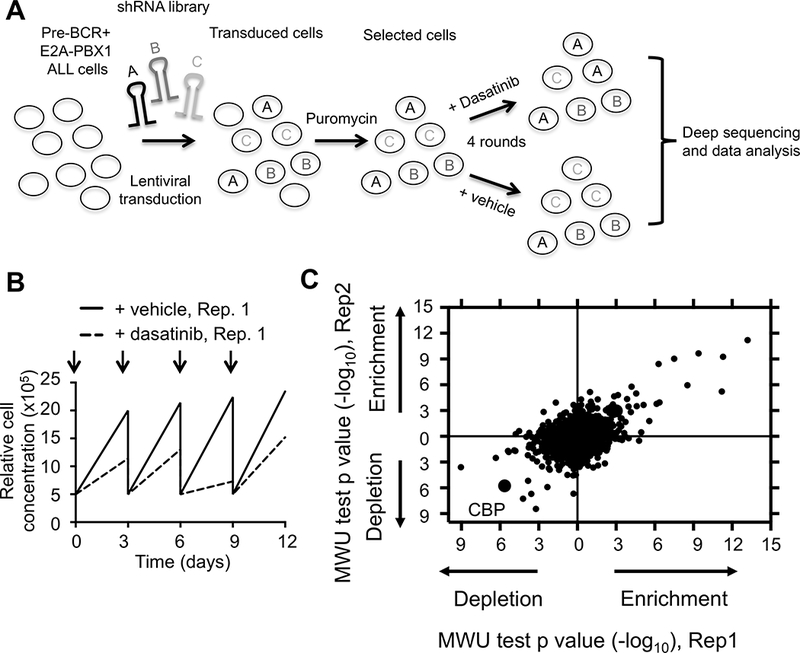
Figure 1. Identification of key genes and pathways involved in dasatinib sensitivity and resistance.

(A) Schematic representation of shRNA screen. RCH-ACV leukemia cells (E2A-PBX1+/pre-BCR+) were transduced with shRNA sub-libraries. After puromycin selection, cells were treated with dasatinib or vehicle every three days for four rounds. Frequency of individual shRNAs was quantified by deep sequencing. The experiment was performed in duplicate. (B) Cell proliferation curves from stably transduced RCH-ACV cells with shRNA sub-libraries in the presence of dasatinib (20nM) from replicate 1 (Rep.1). Arrows represent dasatinib pulses. (C) Dot plot represents Mann-Whitney U test p-values for enrichment (confer resistance) or depletion (increase sensitivity) of shRNAs targeting indicated genes by knock-down in dasatinib-treated cells from two replicates. Each dot represents a gene.
