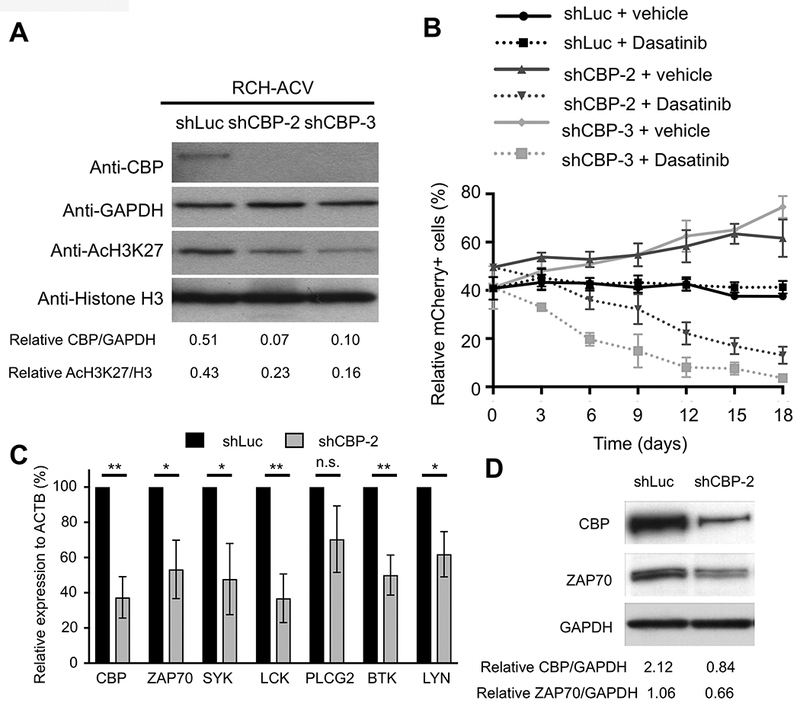
Figure 2. CBP modulates sensitivity to dasatinib.

(A) Representative Western blot shows CBP levels following knock-down by two different shRNA constructs in RCH-ACV cells. Down-regulation of CBP correlates with global decreased levels of H3K27ac. GAPDH and histone H3 were used as loading controls, respectively. Densitometry values shown at the bottom of the panel were calculated using Image J software. Data representative of four independent Western blot experiments. (B) Diagram shows percentage of mCherry+ cells transduced with shRNAs for luciferase (control) or CBP in the presence of vehicle or dasatinib (20 nM) for 18 days. Data represent the mean ±SEM of three independent experiments. (C) Graph shows relative expression of pre-BCR –associated genes by RT-qPCR after shRNA-mediated knockdown of CBP. Data represent the mean ±SEM of three independent experiments. Statistical analysis by Student’s T-test, ** p-value <0.01, * p-value <0.05, n.s., not significant. (D) Western blot (representative of two independent experiments) shows decreased ZAP70 expression levels after shRNA-mediated knockdown of CBP. Densitometry values shown at the bottom of the panel were calculated using Image J software.
