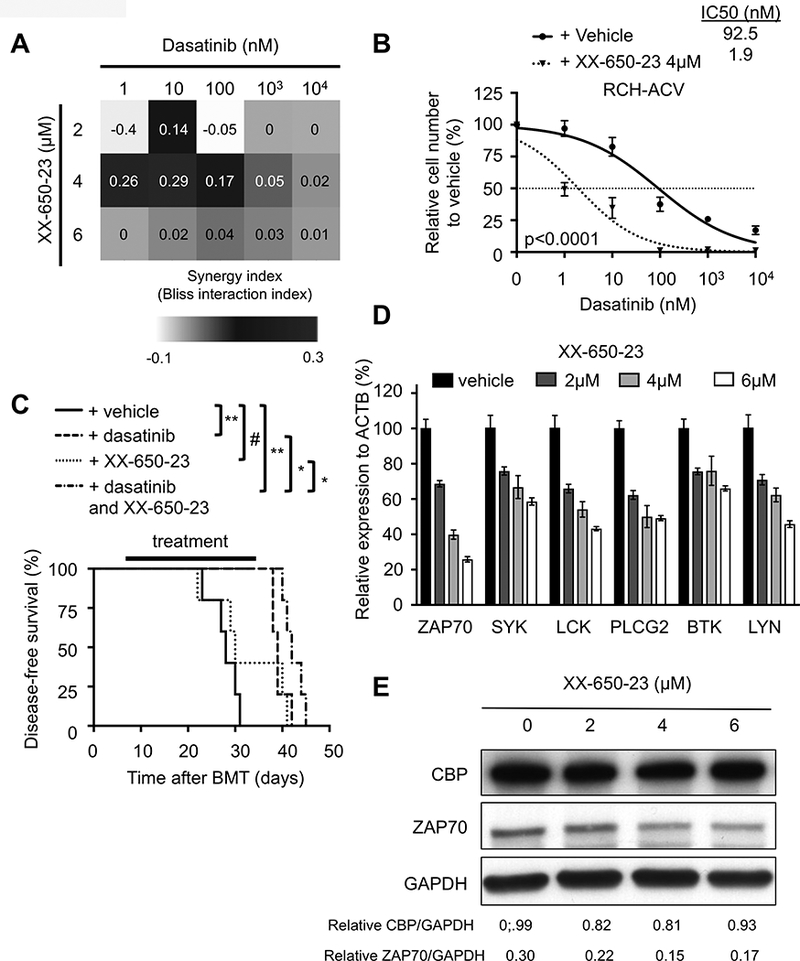
Figure 3. Pharmacologic inhibition of CBP increases sensitivity to dasatinib.

(A) Heat map representation of Bliss interaction index for RCH-ACV cells treated with dasatinib and the CBP-CREB inhibitor XX-650–23. Data represent the mean of three independent experiments. (B) Titration curves shown for RCH-ACV cells cultured with dasatinib in combination with vehicle or XX-650–23 (4 μM). Data represent mean ±SEM of three independent experiments. Statistical analysis was performed by F test. IC50, half maximal inhibitory concentration. (C) Kaplan-Meier curve represents disease-free survival of NSG mice after xenograft transplantation with RCH-ACV cells treated daily with vehicle, dasatinib (2.5 mg/kg/day/d), XX-650–23 (1.25 – 5 mg/kg/d, dose increased stepwise every 4 days with 1.25 mg/kg/d) or the combination of dasatinib and XX-650–23 for 25 days. Each cohort contains five mice. Statistical analysis was performed by log rank test. # not significant; * p<0.05, ** p<0.01. (D) Graph shows relative expression of pre-BCR –associated genes by RT-qPCR after pharmacologic inhibition of CBP in RCH-ACV cells with XX-650–23 at several concentrations. Data represent the mean ±SEM of three independent experiments. (E) Western blot (representative of two independent experiments) shows decreased ZAP70 expression levels after pharmacologic inhibition of CBP with XX-650–23. Densitometry values shown at the bottom of the panel were calculated using Image J software.
