
Figure 5. Global transcriptomic analysis highlights pathways involved in acquired dasatinib resistance.
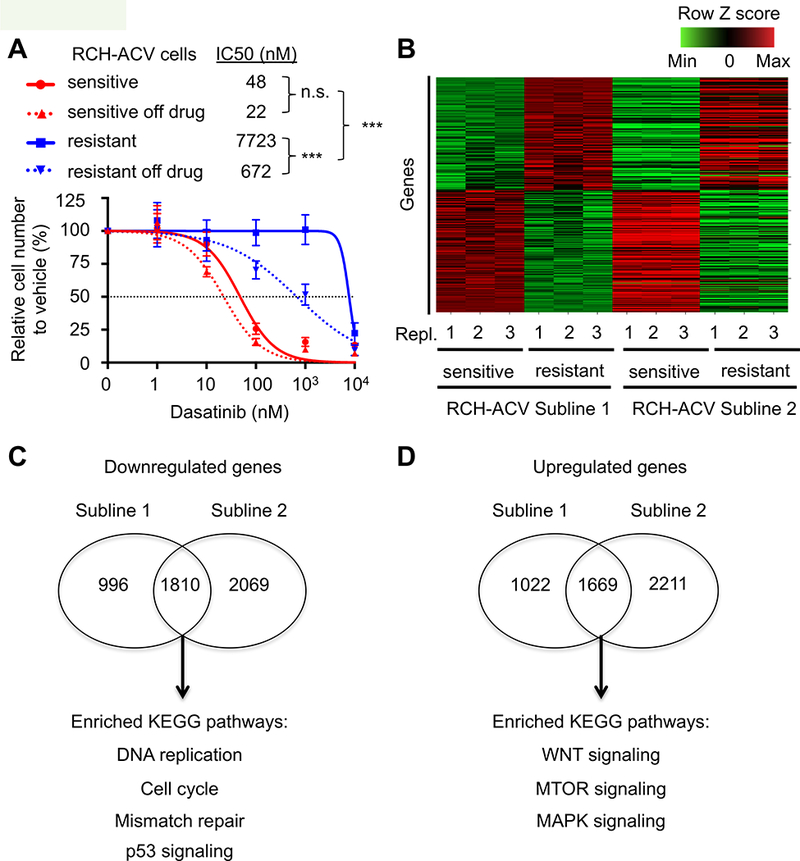
(A) Titration curves shown for RCH-ACV dasatinib-sensitive and -resistant cells treated with increasing concentrations of dasatinib. Titration experiments were also performed on cells after two months of culture following removal from dasatinib selection. Data represent mean ±SEM of three independent experiments. Statistical analysis by F test. n.s., not significant, *** p-value <0.001. IC50, half maximal inhibitory concentration. (B) Heat map represents row Z scores of common up- and downregulated genes analyzed by RNA-seq from two independently generated dasatinib-sensitive and –resistant RCH-ACV sublines. Each column represents a sample, sequenced in triplicate. Each row represents a gene. (C) Gene ontology analysis of KEGG pathways from common downregulated and (D) upregulated genes from generated dasatinib- sensitive and -resistant RCH-ACV sublines. Venn diagrams represent number of genes regulated (p-value<0.05) in common as well as specifically in each clone. Shown below are selected KEGG pathways enriched (p-value <0.05) in the gene ontology analysis from common regulated genes in dasatinib-resistant RCH-ACV sublines.