
Figure 6. Involvement of the WNT signaling pathway in acquired dasatinib resistance.
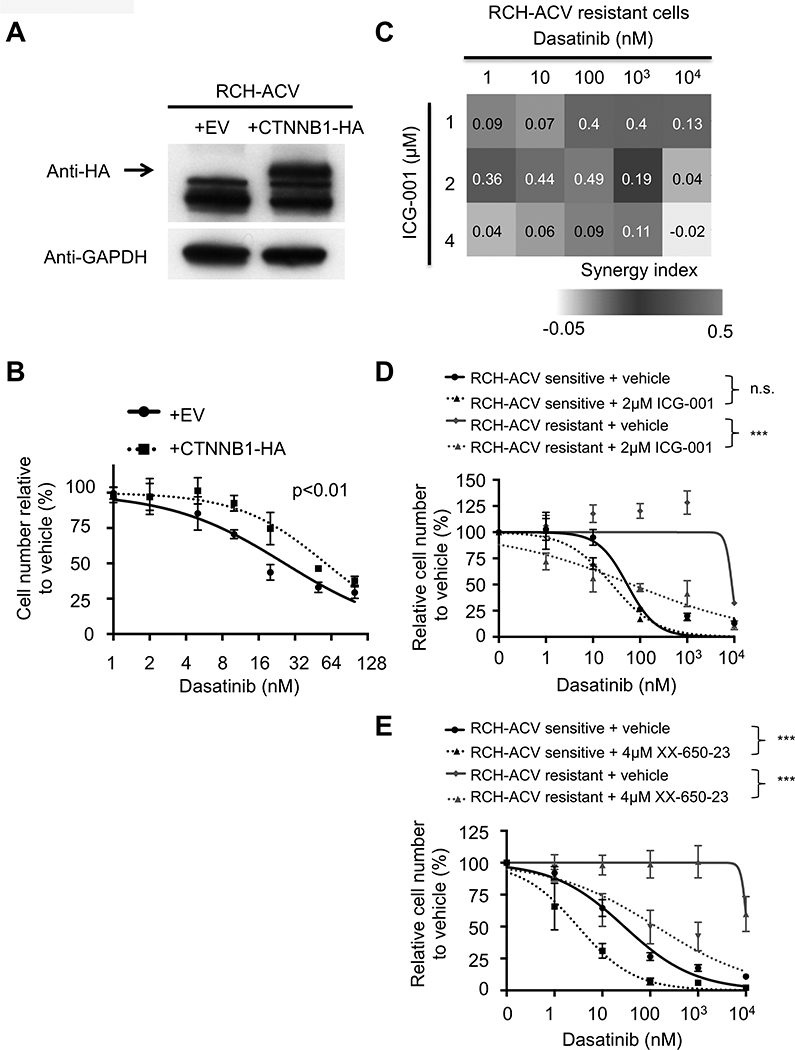
(A) RCH-ACV cells were transduced with retrovirus to ectopically express empty vector (EV) or β-catenin mutant with 4 phosphorylation site mutations in the N-terminal linked to hemagglutinin gene (CTNNB1+HA). Western blot (representative of three independent experiments) shows expression of β-catenin; GAPDH represents loading control. (B) Transduced RCH-ACV cells were cultured at increasing concentrations of dasatinib and cells were enumerated after 4 days. Titration curve data represent mean ±SEM of three independent experiments. Statistical analysis by F test. (C) Heat map representation of Bliss interaction index for dasatinib–resistant RCH-ACV cells treated with dasatinib and the CBP-β catenin inhibitor ICG-001. Data represent the mean of three independent experiments. (D) Dasatininb-sensitive and -resistant RCH-ACV cells were treated with increasing concentrations of dasatinib in combination with ICG-001 (2μM) or (E) XX-650–23 (4μM). Titration curve data represent mean ±SEM of three independent experiments. Statistical analysis by F test. *** p-value<0.001; n.s., not significant.