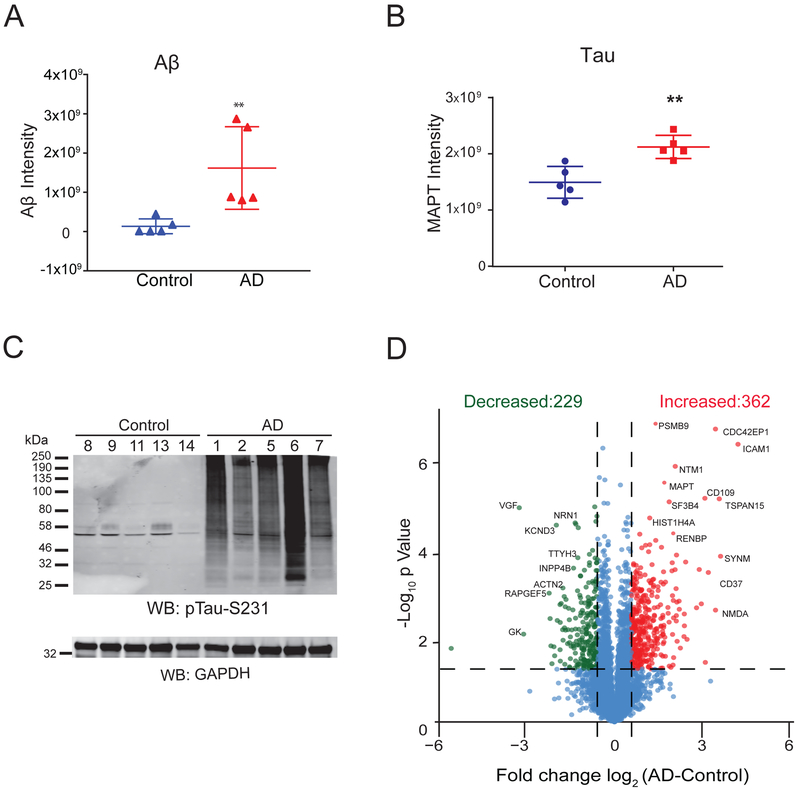
Figure 2.
Quantitative analysis of total brain proteome. A) Comparison of Aβ peptide levels measured by LFQ ion intensities in AD and control brain samples showed a significant increase in Aβ peptide levels in AD. Error bars represent ± SD (**p<0.05). B) Comparison of Tau protein levels in AD vs control cases measured by LFQ ion intensities showed a significant increase in Tau measures in AD. Error bars represent ± SD (**p<0.05). C) AD and control brain samples homogenized in 8M Urea lysis buffer were resolved on SDS-PAGE followed by western blot analysis using anti-pTau-S231 antibody. D) Volcano plot displays individual proteins (log2 fold-change) vs. t test significance [-log10(p value)]. Statistically significant proteins [-log10(p value) ≥ 1.30 and ±1.5-fold-change) are colored as red (increased) or green (decreased) whereas proteins that did not meet criteria are colored in blue. Among these, 362 proteins (red) showed a 1.5-fold-increase in AD samples and 229 proteins (green) showed a 1.5-fold-decrease in AD cases compared to controls.

