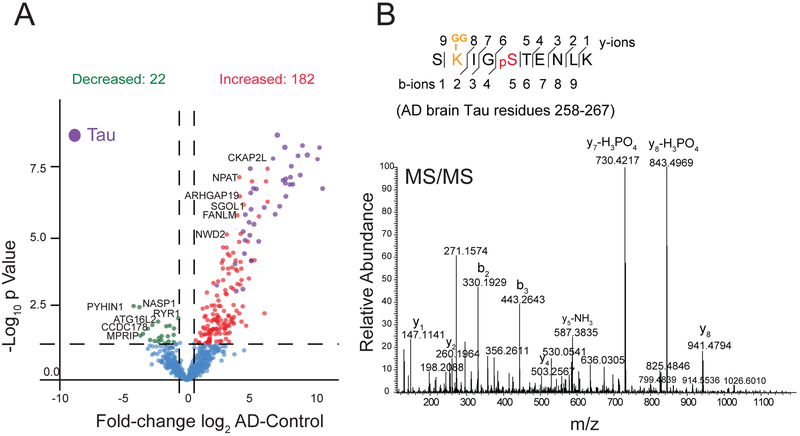
Figure 7.
Co-modification of Tau by phosphorylation and ubiquitylation in AD brain A) Volcano plot displays log2 fold change of intensities in AD versus control of co-modified peptides with both ubiquitylation and phosphorylation sites (minimum ±1.5-fold change, and Student’s t test significance, p<0.05). Red dots represent 182 dually modified peptides significantly increased in AD cases compared to controls and green dots represent 22 dually modified peptides decreased in AD compared to controls. Co-modified peptides from Tau protein are highlighted in purple. B) A representative MS/MS spectrum of a Tau peptide SK-GGIGPSTENLK (Residue 258–267) with ubiquitylation site at K259 and phosphorylation site at S262.

