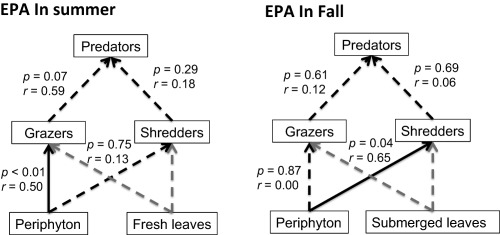
Figure 3.

EPA (20 : 5ω3) pathways from basal food sources to invertebrate consumers. Solid paths are statistically different from 0 at p < 0.05, whereas dashed paths are not. Gray dashed paths indicate those paths do not exist.

EPA (20 : 5ω3) pathways from basal food sources to invertebrate consumers. Solid paths are statistically different from 0 at p < 0.05, whereas dashed paths are not. Gray dashed paths indicate those paths do not exist.