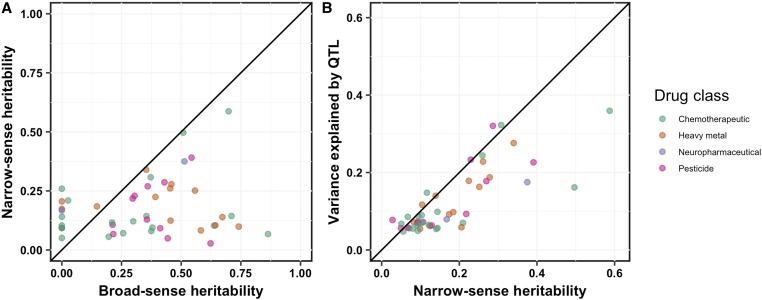
Figure 2.
Additive genetic components identified by linkage mapping do not explain all heritable contributions to toxin-response variation. For 47 principal components representing the 82 QTL, we compared (A) the broad-sense heritability (x-axis) calculated from the recombinant inbred advanced intercross line phenotypic data vs. the narrow-sense heritability (y-axis) estimated by a mixed model, and (B) the narrow-sense heritability (x-axis) vs. the variance explained by all QTL detected by linkage mapping (y-axis). In both plots, each principal component is plotted as a point whose color indicates drug class (chemotherapeutic, heavy metal, neuropharmaceutical, or pesticide). The diagonal line represents y = x and is shown as a visual guide.

