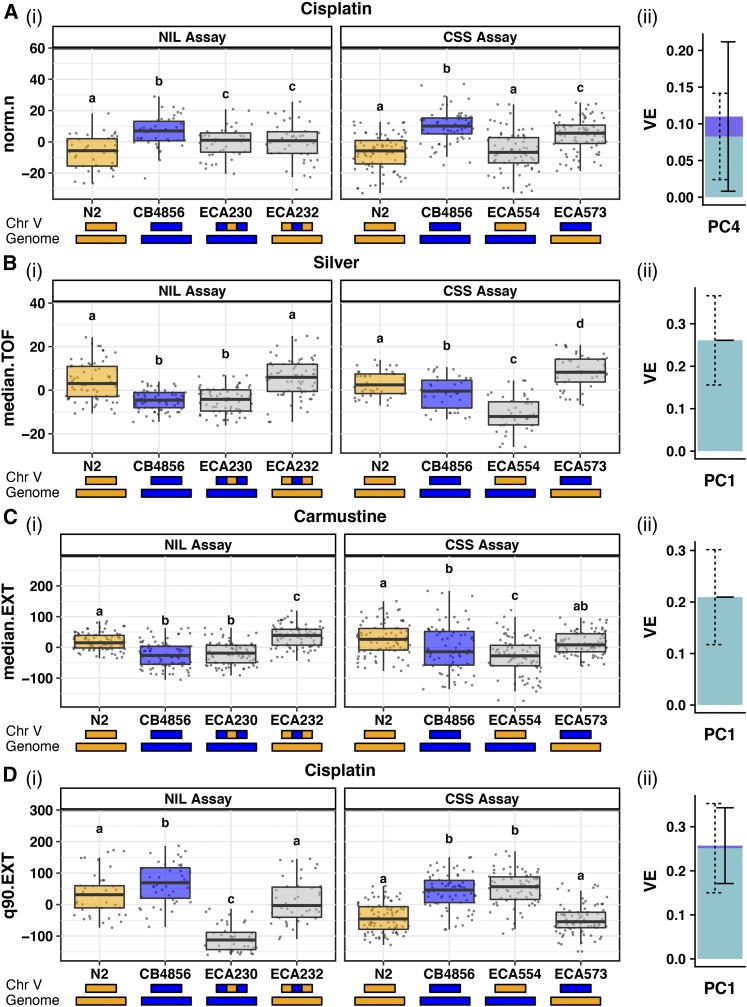
Figure 4.
Results from NIL and CSS tests of recapitulation of QTL effects are categorized based on potential genetic mechanisms implicated in toxin responses. A trait contributing to a mapped PC for each category is reported: (A) Recapitulation (cisplatin norm.n, PC4), (B) interchromosomal external bidirectional loci (silver median.TOF, PC1), (C) interchromosomal internal unidirectional loci (carmustine median.EXT, PC1), and (D) intrachromosomal unidirectional loci (cisplatin q90.EXT, PC1). In each case, we show results from (i) the NIL assay (left) and CSS assay (right) plotted as Tukey box plots. The y-axis indicates residual phenotypic values for the given trait. Different letters (a–d) above each Tukey box plot represent significant differences (P < 0.05), while the same letter represents nonsignificant differences between two strains (Tukey’s honest significant difference). The genotype of each strain on the x-axis is modeled by the colored rectangles beneath the plots (N2 genotypes are orange and CB4856 genotypes are blue). (ii) A stacked bar plot shows the proportion of phenotypic variation attributable to additive (light blue with dashed error bars) and interactive (dark blue with solid error bars) genetic factors of the PC represented by each trait, based on a mixed model. Chr, chromosome; CSS, chromosome substitution strain; EXT, extinction; NIL, near-isogenic line; PC, principal component; TOF, time of flight; VE, variance explained estimate.

