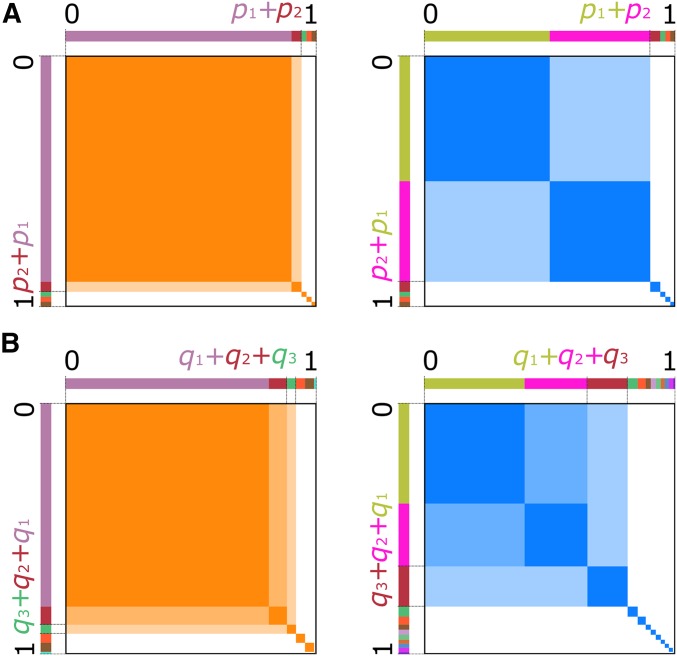
Figure 1.
Visual representation of the haplotype- and MLG-based statistics. For all panels, the total area of the orange or blue squares within a panel represents the value of the statistics. Hard sweep scenarios are in orange, and soft sweeps are in blue. (A) Under a hard sweep (left), a single haplotype rises to high frequency, so the probability of sampling two copies of that haplotype is Choosing as the largest frequency yields H1 (dark orange area), while pooling as the largest frequency yields H12 (total orange area). Under a soft sweep (right), pooling the largest haplotype frequencies results in a large shaded area, and therefore H12 has a similar value for both hard and soft sweeps. (B) Under Hardy-Weinberg equilibrium, a single high-frequency haplotype produces a single high-frequency MLG (frequency ). Pooling frequencies up to has little effect on the value of the statistic, thus G1, G12, and G123 have similar values. When two haplotypes exist at high frequency, three MLGs exist at high frequency. Under a soft sweep, pooling the largest two MLGs (G12) may provide greater resolution of soft sweeps than not pooling (G1), and pooling the largest three creates a statistic (G123) truly analogous to H12.

