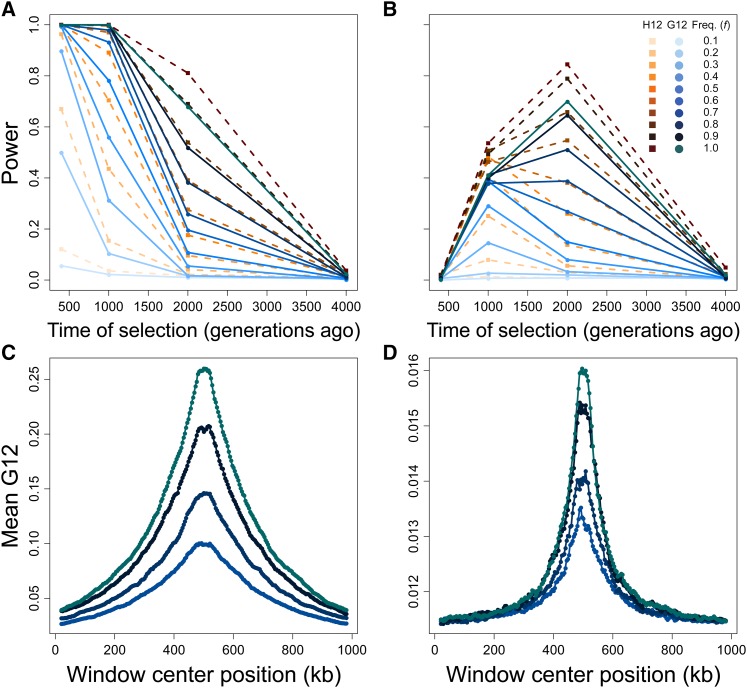
Figure 3.
Capabilities of H12 (orange) and G12 (blue) to detect hard sweeps from simulated chromosomes, sample size diploids, and window size of 40 kb for selection across four time points (400, 1000, 2000, and 4000 generations before sampling) and 10 sweep frequencies (f, frequency to which the selected allele rises before becoming selectively neutral). Selection simulations conditioned on the beneficial allele not being lost. (A) Powers at a 1% FPR of H12 and G12 to detect strong sweeps in a 100 kb chromosome. (B) Powers at a 1% FPR of H12 and G12 to detect moderate sweeps in a 100 kb chromosome. (C) Spatial G12 signal across a 1 Mb chromosome for strong sweeps occurring 400 generations prior to sampling. (D) Spatial G12 signal across a 1 Mb chromosome for moderate sweeps occurring 2000 generations prior to sampling. Lines in (C and D) are mean values generated from the same set of simulations as (A and B), and contain only results for Note that vertical axes in (C and D) differ.

