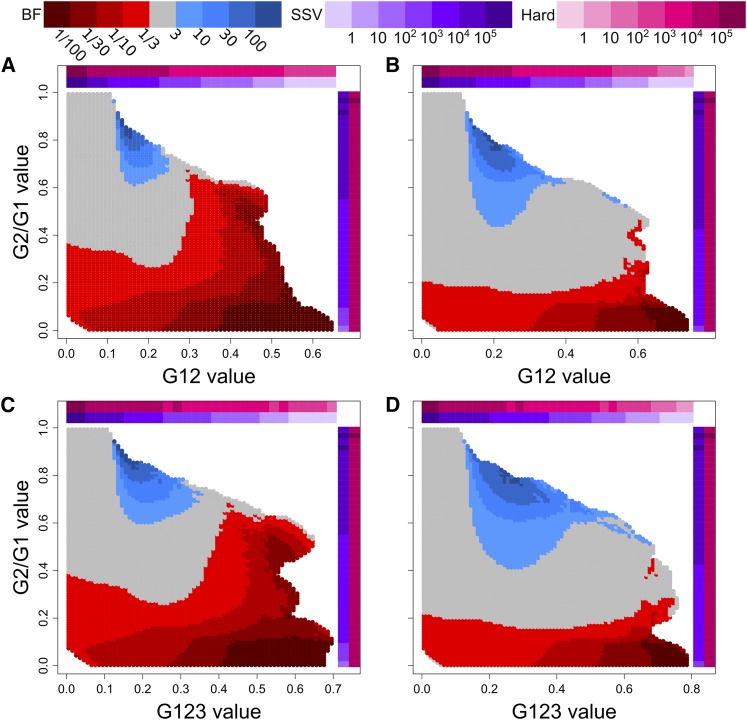
Figure 5.
Assignment of BFs to tested paired values of (G12, G2/G1) and (G123, G2/G1). Plots represent the relative probability of obtaining a paired (G12, G2/G1) or (G123, G2/G1) value within a Euclidean distance of 0.1 from a test point for hard vs. soft sweeps, determined as described in Materials and Methods. Selection coefficients (s) and times (t) were drawn as described in Materials and Methods. Red regions represent a higher likelihood for hard sweeps, while blue regions represent a higher likelihood for soft sweeps. Colored bars along the axes indicate the density of G12 or G123 (horizontal) and G2/G1 (vertical) observations within consecutive intervals of size 0.025 for hard sweep (magenta) and SSV (purple) simulations. (A) BFs of paired (G12, G2/G1) values for hard sweep scenarios and SSV scenarios (B) BFs of paired (G12, G2/G1) values for hard sweep scenarios and SSV scenarios (C) BFs of paired (G123, G2/G1) values for hard sweep scenarios and SSV scenarios (D) BFs of paired (G123, G2/G1) values for hard sweep scenarios and SSV scenarios Only test points for which at least one simulation of each type was within a Euclidean distance of 0.1 were counted (and therefore colored).

