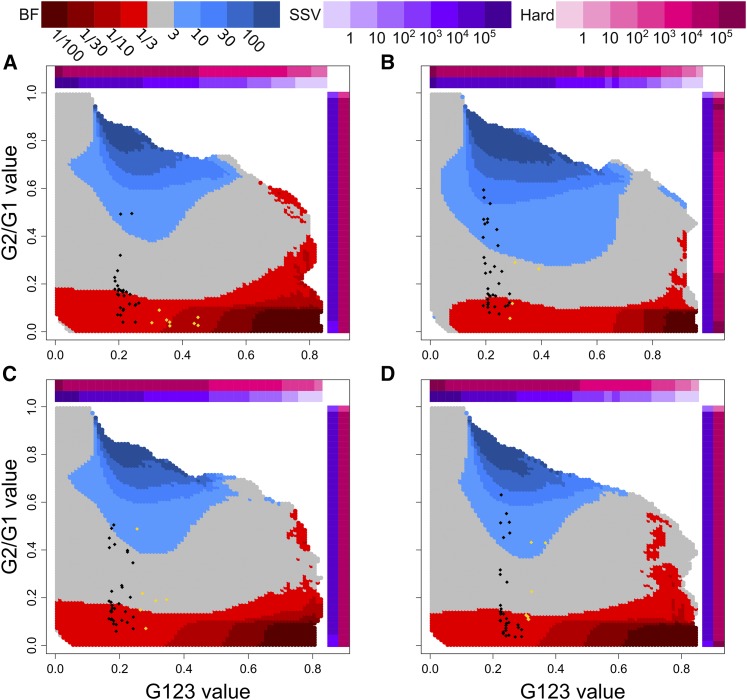
Figure 6.
(G123, G2/G1) values used to distinguish hard (red) and soft (blue) sweeps in human empirical data using demographic models inferred with smc++ (Terhorst et al. 2017). Points representing the top 40 G123 selection candidates (Tables S4, S7, S10, and S13) for the (A) CEU, (B) YRI, (C) GIH, and (D) CHB populations are overlaid onto each population’s specific (G123, G2/G1) distribution. Candidates exceeding the significance threshold (Table S1; different for each population) are colored in gold. Colored bars along the horizontal (G123) and vertical (G2/G1) axes are defined as in Figure 5.

