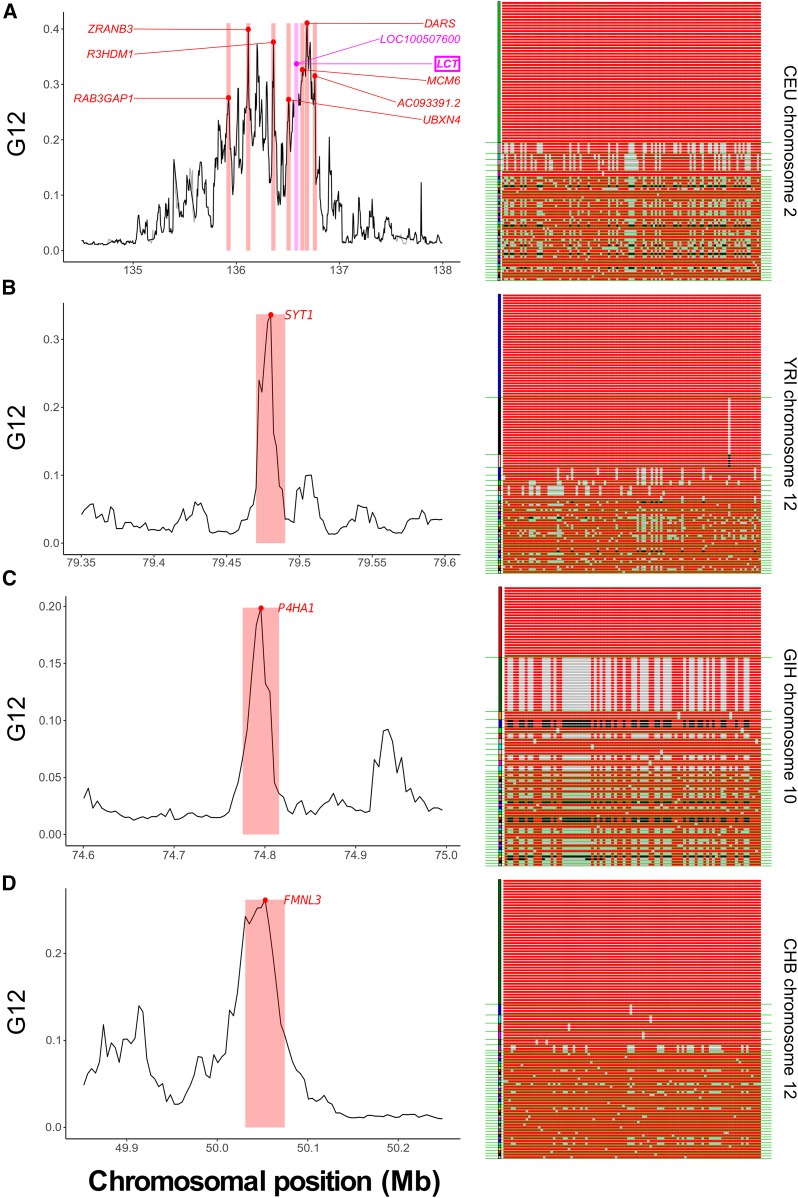
Figure 7.
Outlying G12 signals in human genomic data. For each population, we show a top selection candidate and display its sampled MLGs within the genomic window of maximum signal. Red and black sites are homozygous genotypes at a SNP within the MLG, while gray are heterozygous. Green lines separate MLG classes in the sample. (A) CEU chromosome 2, centered around LCT, including other outlying loci (labeled). LOC100507600 is nested within LCT (left). A single MLG exists at high frequency, consistent with a hard sweep (right). (B) YRI chromosome 12, centered on SYT1 (left). This signal is associated with two elevated-frequency MLGs (right). (C) GIH chromosome 10, centered on P4HA1 (left). Two MLGs exist at high frequency (right). (D) CHB chromosome 12, centered on FMNL3 (left). A single MLG predominates in the sample (right).

