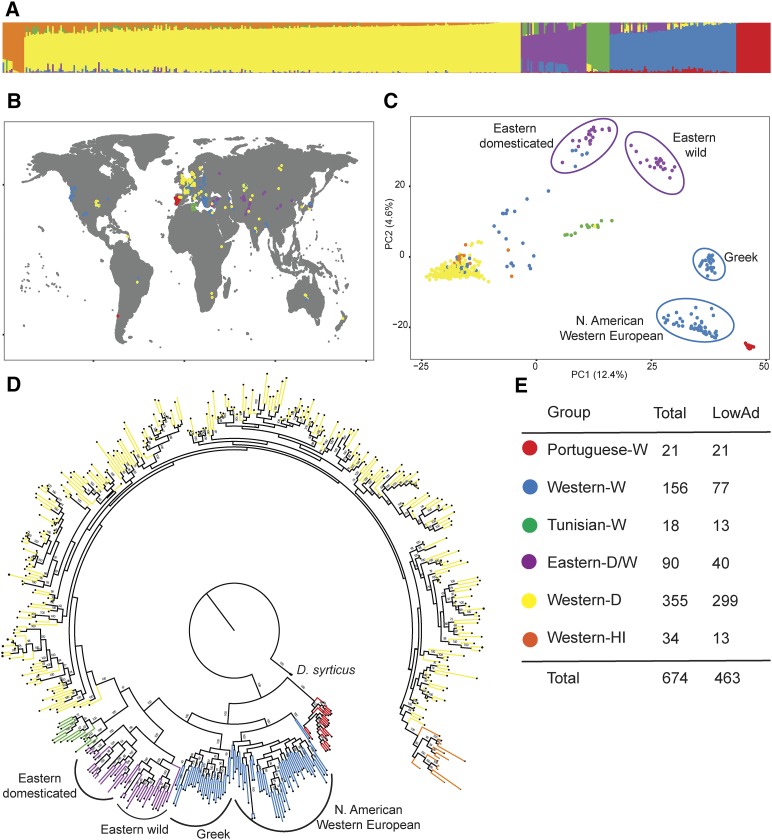
Figure 2.
Population structure of 463 carrot accessions with admixture (D2-LowAd). (A) STRUCTURE groups. Percentage of membership (q) for each group identified at K6. (B) Geographic distribution of accessions, each represented by a point on the map colored according to STRUCTURE group. Current commercial varieties not shown. (C) Principal component (PC) analysis plot of the first two principal components. PC1 and PC2 account for 12.4 and 4.6% of the total variation, respectively. (D) Maximum-likelihood tree of carrot accessions. Numbers on the branches indicate bootstrap support. Black branch represents outgroup D. syrticus. (E) Color key. Total number of accessions in each STRUCTURE Group. LowAd, low admixture.

