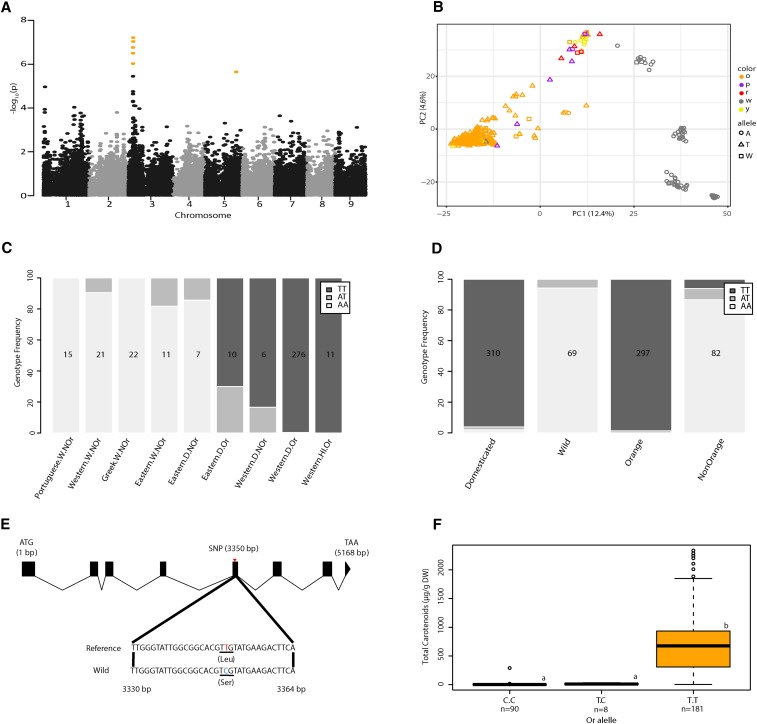
Figure 3.
Genome-wide association analysis of orange pigmentation and identification of the candidate gene Or on chromosome 3. (A) Manhattan plot for orange carrot root color. SNPs with empirically-adjusted P-values < 0.05, were defined as significant and are colored orange. (B) Allele frequency of SNP S3_5228434 and pigmentation classification superimposed on the principal component analysis from Figure 2C. o, orange; p, purple; r, red; w, white; y, yellow. (C) SNP S3_5228434 genotype frequency separated by STRUCTURE classification. Or and NOr indicates orange or nonorange root pigmentation. W, D, or HI is wild, domesticated, or Hybrid Imperator, respectively. (D) SNP S3_5228434 genotype frequency separated by root pigmentation and domestication status. Quantities indicate the number of samples in each group. (E) Open reading frame of Or and the nonsynonymous mutation in exon 5 at position 3350 (T3350C). (F) Box plots for total carotenoids for the three Or genotypes (C/C, T/C, and TT) at position 3350. Center line median, box limits upper and lower quartiles, whiskers = 1.5× the interquartile range, dots outliers. Different letters indicate significant differences between genotypes (P < 0.05, Tukey’s honest significant difference). Reported values are in dry weight.

