Figure 4.
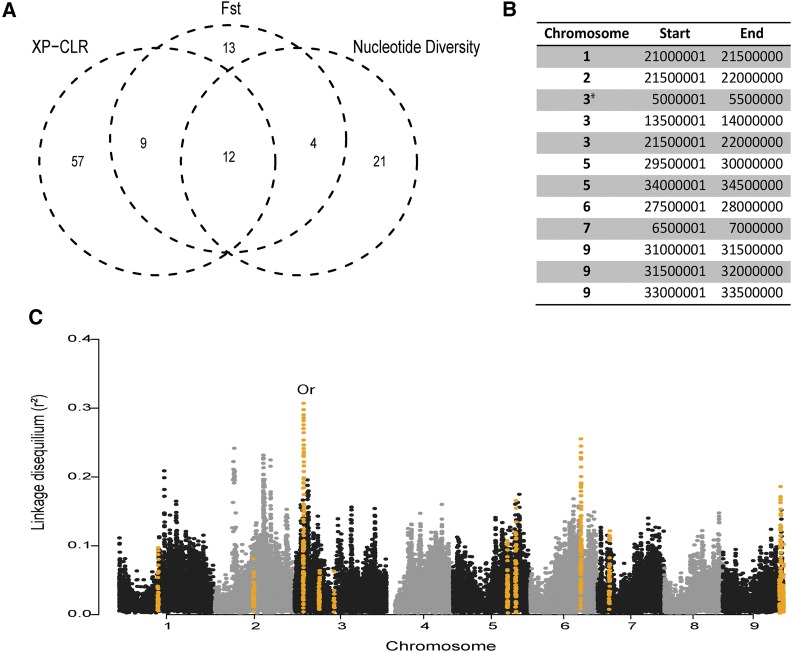
Regions of the carrot genome that likely underwent a selective sweep during domestication. (A) Venn diagram represents the overlapping of 500-kb regions tested for selection signatures: top 5% of Fst and nucleotide diversity difference between wild and domesticated carrot accessions, and top 1% of cross-population composite likelihood ratio (XP-CLR) values. (B) Genomic location of potential selective sweeps identified by Fst, nucleotide diversity, and XP-CLR. The asterisk signifies the genome region carrying the candidate orange pigmentation gene Or. (C) Genome-wide linkage disequilibrium averaged across sliding windows of 100 SNPs in domesticated carrots. Regions identified as significant in (A) and (B) are highlighted in orange. The region containing the Or candidate gene for orange pigmentation in carrot is marked “Or.”

