Figure 5.
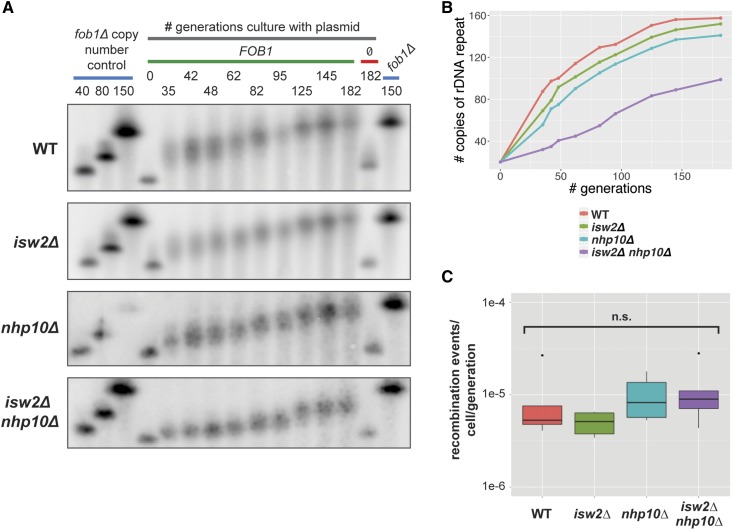
Isw2 and Ino80 affect the rate of rDNA copy number change. (A) rDNA copy number change assay. Blue bars indicate fob1∆ copy number control strains that maintain the indicated number of rDNA repeats (identical 150-copy control samples run on both ends of the gel to facilitate comparison of band migration). The gray bar indicates samples grown in a time course for the indicated number of generations, in selective medium to ensure retention of either a plasmid containing FOB1 (green bar) or the plasmid backbone pRS426 without FOB1 (red bar). (B) Quantification of the copy number change assay. Average copy number at each time point was calculated based on migration of bands relative to controls. (C) URA3 recombination assay. Cells were grown under selection, then without selection for ∼10 generations, then plated on 5-FOA plates. Number of recombination events per cell per generation determined based on number of 5-FOA-resistant colonies. Statistical significance tested by pairwise t-tests followed by Bonferroni correction for multiple testing. n.s., not significant.

