
Figure 1.
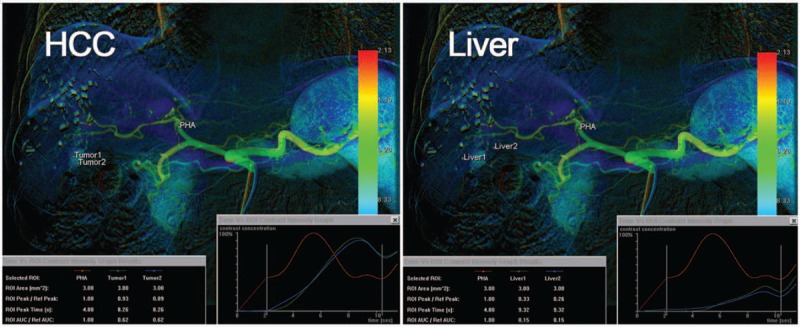
Five regions of interest [ROIs; 1 on the proper hepatic artery as a reference, 2 on the target HCC, and the other 2 on the peritumoral liver parenchyma for average measurements] were manually drawn. Time-concentration curves were obtained for each ROI, along with 3 parameters: the peak ratio, TTP attenuation, and AUC ratio. AUC = area under the curve, HCC = hepatocellular carcinoma, ROI = regions of interest, TTP = time-to-peak.