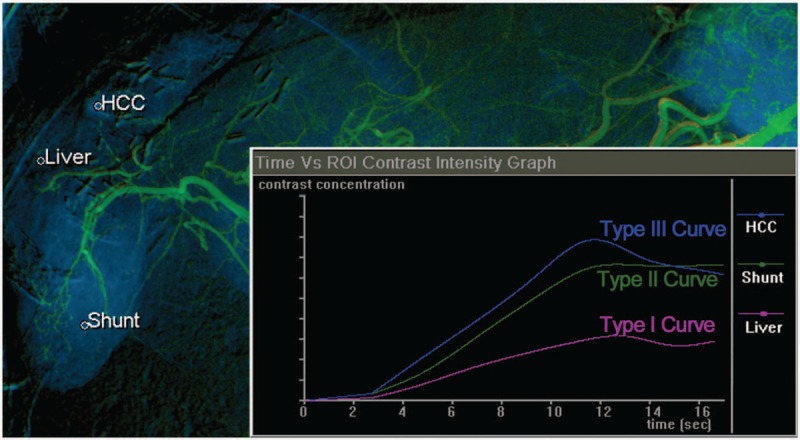
Figure 2.

Time-concentration curves were obtained for each ROI and divided into 3 types. The Type I curve (progressive pattern) shows slowly progressive enhancement over time. The Type II curve (plateau pattern) shows relatively rapid enhancement followed by the plateau phase. The Type III curve (washout pattern) shows rapid enhancement followed by the early washout pattern. In this case, cirrhotic liver parenchyma showed a Type I curve and the HCC showed a Type III curve. Angiography also showed a hypervascular lesion in segment 6, which had a Type II curve. Arterioportal shunt was suspected because the follow-up images showed no retention of the embolized fragment after transarterial chemoembolization. HCC = hepatocellular carcinoma.
