
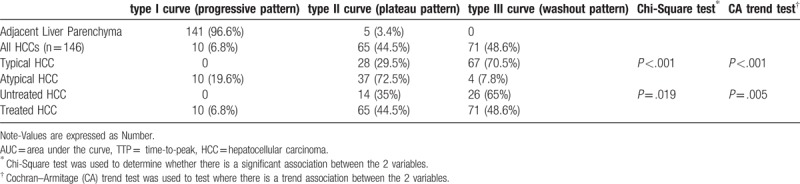
Table 3.
Cross-tabulation of the time-concentration curves and the selective regions of interest (ROIs), measured with QDSA technique.
Official websites use .gov
A
.gov website belongs to an official
government organization in the United States.
Secure .gov websites use HTTPS
A lock (
) or https:// means you've safely
connected to the .gov website. Share sensitive
information only on official, secure websites.
Cross-tabulation of the time-concentration curves and the selective regions of interest (ROIs), measured with QDSA technique.