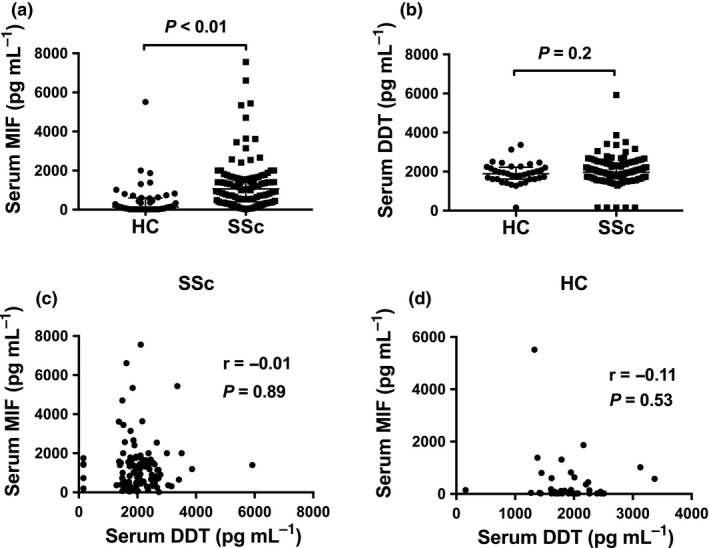
Figure 1.

Serum MIF and DDT in SSc and HC. (a) Serum MIF concentrations in HC (n = 47) and SSc (n = 105) samples. (b) Serum DDT concentrations in HC (n = 37) and SSc (n = 102) samples. Correlation between serum MIF and DDT concentrations in (c) SSc patients and (d) HC. Panels a and b: horizontal bars indicate medians, and corresponding error bars indicate interquartile ranges; medians were compared using Wilcoxon rank‐sum test. Panels c and d: correlations were examined using Spearman's correlation test.
