
Figure 3.
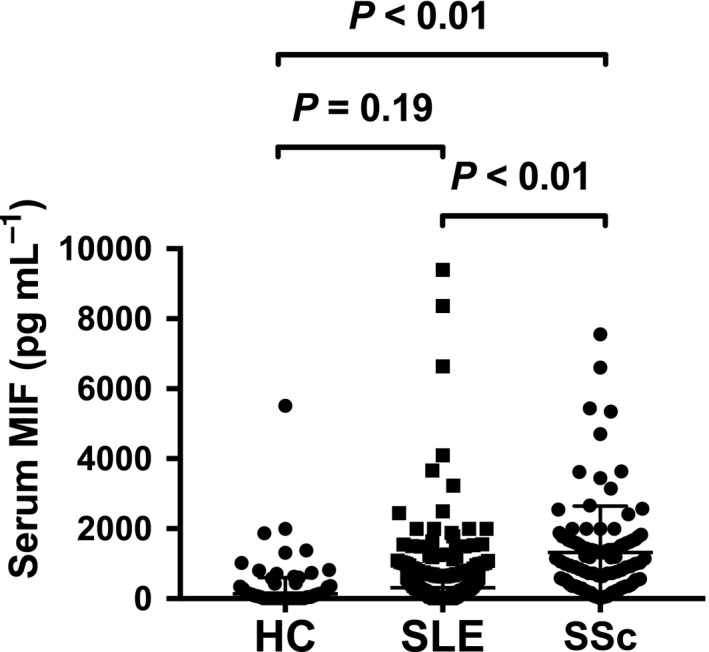
Serum MIF in SSc, SLE and HC. Serum MIF concentrations in HC (n = 47), SLE (n = 184) and SSc (n = 105) samples. Horizontal bars indicate medians and corresponding error bars indicate interquartile ranges; medians were compared using Dunn's multiple comparison test following Kruskal–Wallis test.