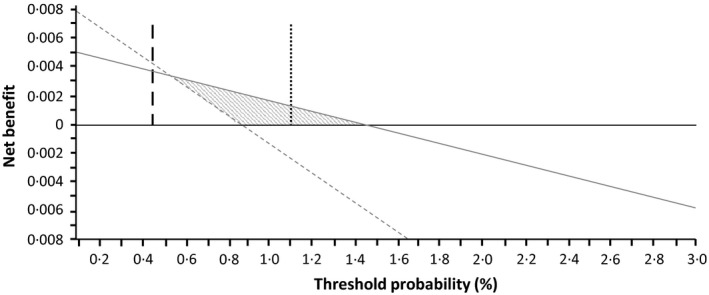
Figure 1.

Decision curve analysis. Grey line represents scenario where VTE‐BLEED is used to treat low risk patients but not high risk patients; Horizontal black line represents scenario where all patients are assumed to be of low risk and none are treated with discontinuation of anticoagulants (all receive anticoagulants); dashed grey line represents scenario in which all patients are assumed to be a high risk and all are treated with anticoagulant discontinuation (none receive anticoagulants); vertical long dashed black line represents prevalence of major bleeding in Rivaroxaban‐treated patients in the sensitivity analysis; vertical dotted dashed black line represents prevalence of major bleeding in vitamin K antagonist‐treated patients in the sensitivity analysis. Grey shaded area represents the range of threshold probabilities for which use of VTE‐BLEED is associated with a net clinical benefit over not using the score. Importantly, risks of VTE are not taken into account. VTE, venous thromboembolism.
