
Figure 4.
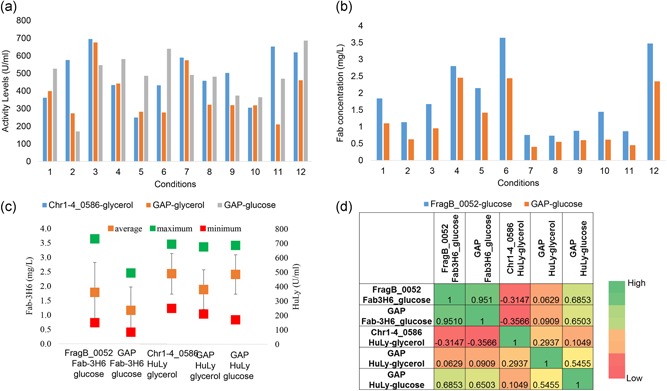
R‐protein production across different conditions. The strains producing HuLy and Fab‐3H6 were cultivated under 12 different conditions and the secreted r‐protein levels were compared. (a) Secreted HuLy activity levels at stationary phase across 12 conditions by cells expressing HuLy under oSPI1 promoter when glycerol used as the carbon source (blue), under GAP promoter when glycerol or glucose was used as the carbon source (orange and gray, respectively). (b) Secreted Fab‐3H6 concentrations at stationary phase across 12 conditions by the cells expressing antibody under the TEF1‐⍺ (blue) and GAP (orange) promoters when glucose was used as the carbon source. (c) The green and red squares represent the maximum and minimum level of r‐protein concentrations observed across 12 tested conditions, respectively. The orange square represents the average of the protein level attained in those 12 conditions. Error bars represent the variation across the conditions. (d) Spearman correlation coefficient values between the rankings of the conditions from high to low level of r‐protein between different strains. GAP: glyceraldehyde‐3‐phosphate dehydrogenase promoter; HuLy: human lyzozyme; TEF1‐⍺: translational elongation factor EF‐1 alpha