
Figure 5.
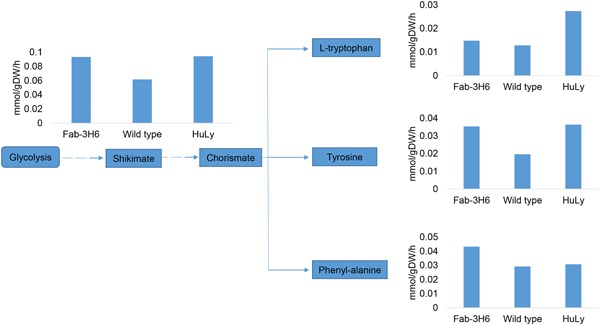
In silico flux distribution through the aromatic amino acid pathway. The bar graphs indicate flux values going through each of these linear pathways when simulations were done for the expression of Fab‐3H6, HuLy or wild‐type case. HuLy: human lyzozyme