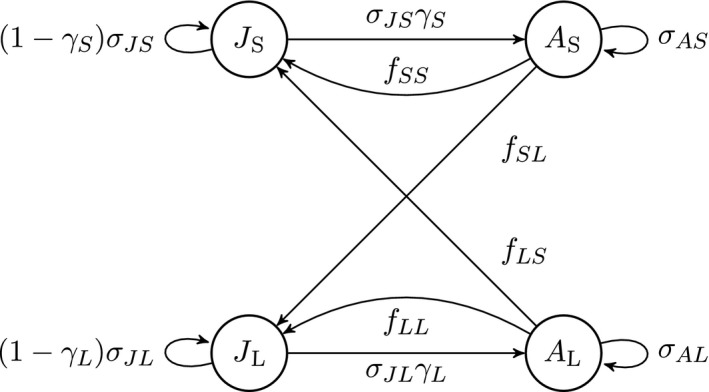
Figure 1.

Life cycle graph for the example species. The nodes represent the four stages: small juvenile (J S), large juvenile (J L), small adult (A S) and large adult (A L). The arrows represent survival, maturation, and reproduction. The per‐time‐step probabilities of survival (σJS, σJL, σAS, σAL) and maturation (γS, γL) and the per‐time‐step production of new individuals (f SS, f SL, f LS, f LL) all depend on age, x.
