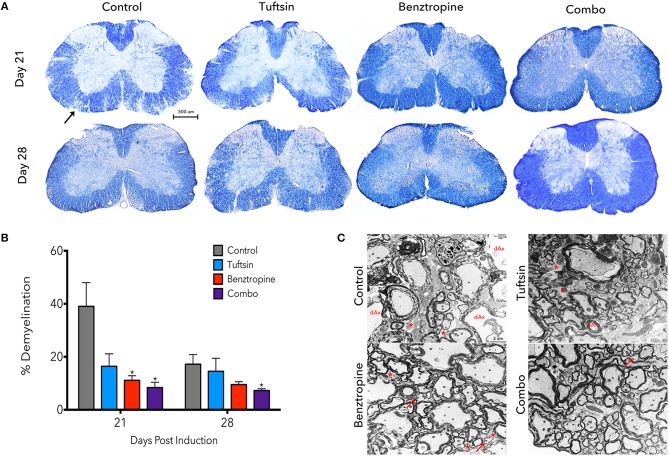
Figure 2.
Demyelination is reduced throughout the disease course with a combinatorial treatment strategy. The lumbar spinal cord region was isolated from control, tuftsin-treated, benztropine-treated, or combo-treated mice at days 21 and 28 post-MOG immunization. Eriochrome cyanine stain was used to visualize demyeliation as myelinated regions of the white matter stain dark blue and demyelinated areas are diminished in color. Black arrow shows example of demyelinated area. Images of full coronal sections are shown (A). Demyelinated areas were measured using ImageJ and quantified by subtracting the myelinated area of the white matter from the total area of the white matter and normalizing to total area (B). Data are mean ±SEM. n = 5–7, *p < 0.05 compared to control. Scale bar: 500 um. At day 21, myelin was also visualized using transmission electron microscopy. Representative images from the ventral white matter are shown (C). Degenerating axons (dAx) is characterized by diffuse cytoplasmic staining (31). Arrows indicate thin myelin indicative of remyelination. Demyelinated axons are marked by asterisks. Scale bar: 2 um.

