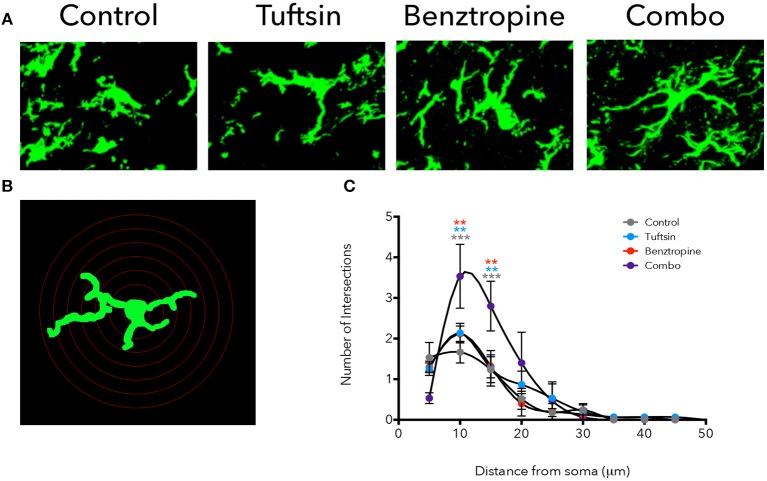
Figure 4.
Treatment with tuftsin and benztropine alters complexity of microglial morphology. The lumbar spinal cord was isolated from EAE mice at day 21. To visualize microglia, Iba1 immunostaining (green) was performed and 20 micron z-stacks of the cells were imaged using confocal microscopy (A). Fluorescent images were traced in Neurolucida software and 3D reconstructions from the tracings were analyzed using the linear Sholl analysis with 5 um concentric rings (B). Number of intersections at each distance from the soma was averaged from 5 cells/animal and plotted (C). Comparisons are between control and combination (gray asterisks), tuftsin and combination (blue asterisks), and benztropine and combination (red asterisks). Data are mean ± SEM. n = 3 animals, 5 cells/animal analyzed, **p < 0.01, ***p < 0.001.

