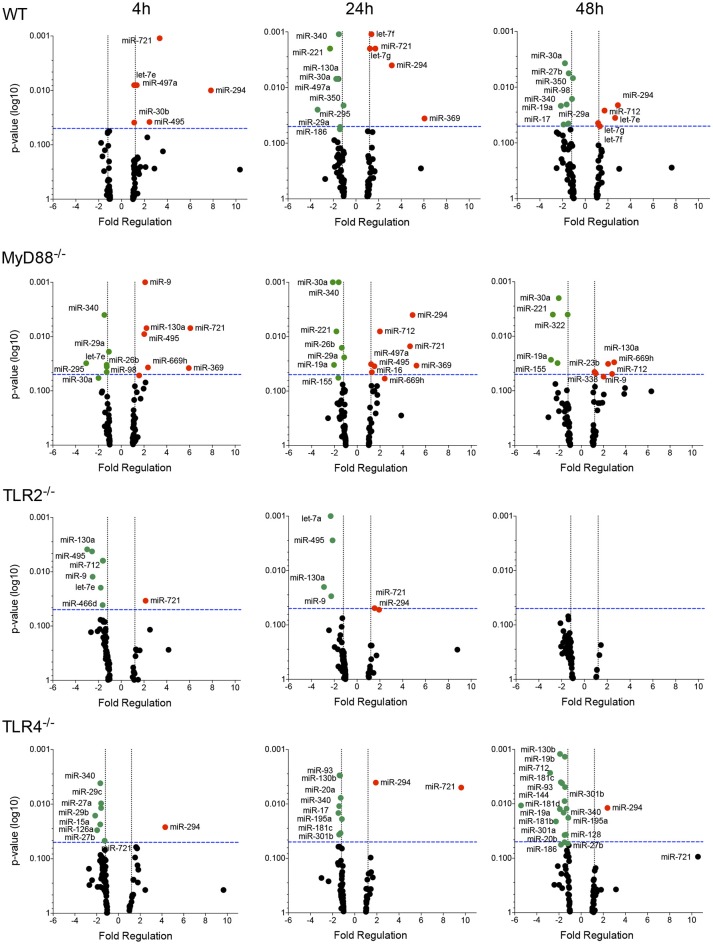
Figure 3.
Volcano plot of the miRNA profiles of macrophages from WT, MyD88, TLR2 and TLR4 null mice infected with L. amazonensis. Each dot represents the level of one miRNA in BMDMs from WT, MyD88−/−, TLR2−/−, or TLR4−/− mice infected with L. amazonensis for 4, 24, and 48 h. The red dots indicate upregulated miRNAs and green dots indicate downregulated miRNAs. The blue dotted line corresponds to p = 0.05, log 10. The relative upregulation and downregulation of miRNAs are presented as boundaries of 1.2 or −1.2 of Fold Regulation, respectively. P-values were determined using two-tailed Student's t-tests. Representative data from three independent experiments are presented.

