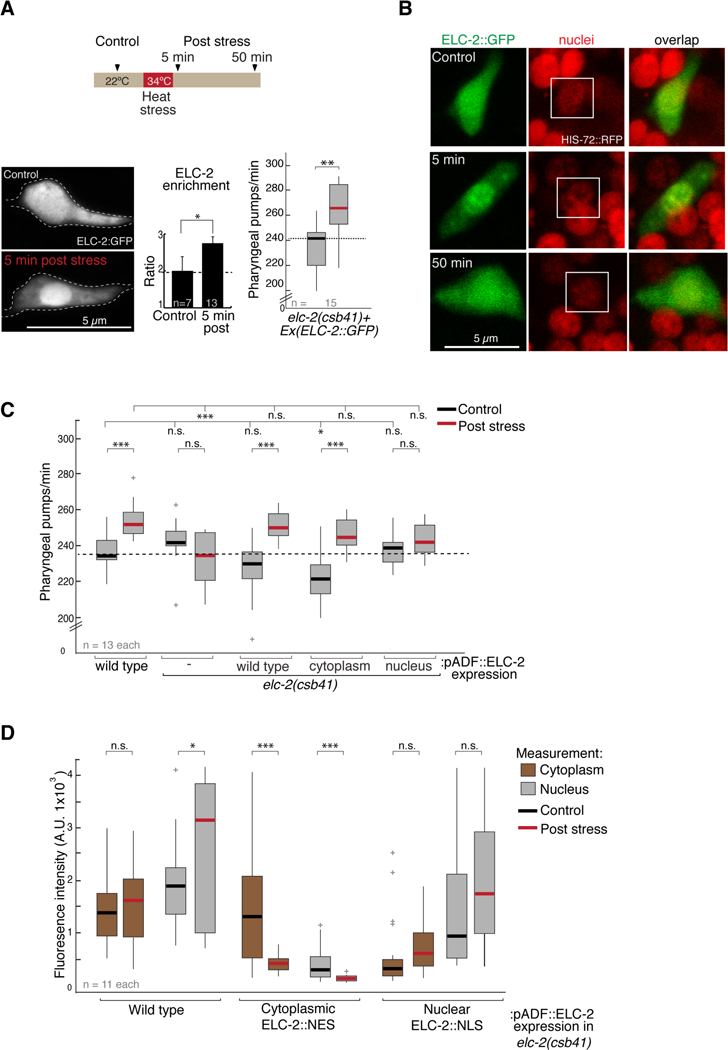
Figure 4. ELC-2 subcellular localization is sensitive to heat stress and correlates with behavior.

(A) Top: schematic of heat stress paradigm. Images were captured ~5 or 50 minutes after heat shock. Bottom left: confocal microscopy images show ELC-2::GFP distribution in the ADF soma before (control) and after heat stress. Middle plot shows quantification of data collected from images on left. Right: Pumping in elc-2 mutant animals rescued with extrachromosomal array containing ELC2::GFP fosmid. Black and red bar on box: control and 1h post stress, respectively. Student t test, ** p < 0.005, * p < 0.05.
(B) Left: ELC-2::GFP and nuclei at three time points: prior to heat stress, 5 and 50 minutes post-heat stress. Nuclei visualized using a strain expressing Histone H2B/HIS-72 tagged with RFP.
(C) Pumping rates measured in wild type or elc-2 mutants expressing different extrachromosomal array versions of ELC-2::GFP tagged with a NES (cytoplasm) or a NLS (nucleus) using ADF-specific promoter. 1-way ANOVA with Dunnet’s correction is used for comparisons across genotypes; Student’s t test is used for comparisons within genotype. *** p<0.0005, ** p<0.005, *p<0.05, n.s. not significant. Box plot outliers +.
(D) Measurement of confocal Z-stack GFP intensity of the nucleus and cytoplasm before and after heat stress in the strains used for assessing behavior. Expression pattern in S4E. Student’s t test: *** p<0.0005, ** p<0.005, *p<0.05, n.s. not significant. Box plot outliers +.
See also Figure S4.
