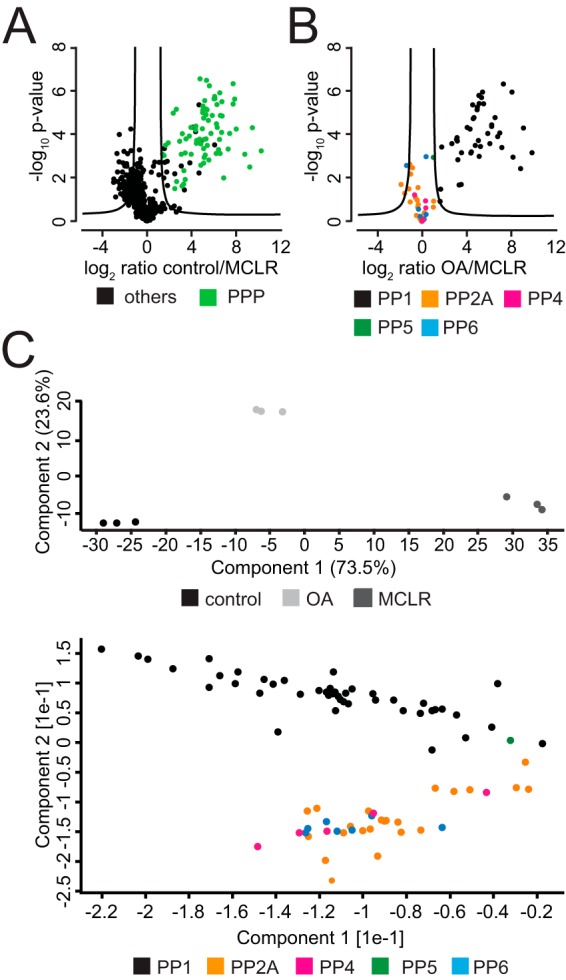
Fig. 3.

Comparison of PPP binding upon MCLR and OA treatment. (A) Volcano plot of PIB-MS analyses of control and MCLR-treated HeLa lysates. (B) Volcano plot of PIB-MS analyses of known PPP subunits of OA- and MCLR-treated HeLa lysates. (C) Principal component analysis of PIB-MS analyses of known PPP subunits of OA- and MCLR-treated HeLa lysates.
