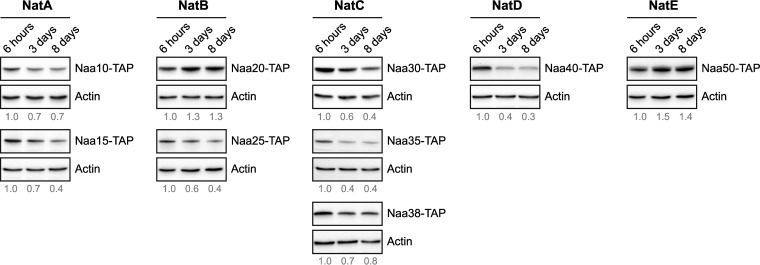
Fig. 5.
Protein expression profiles of NAT subunits upon entry into stationary phase. Yeast cells endogenously expressing a TAP-tagged NAT subunit were grown in rich medium and harvested at indicated time points. Whole cell extracts were analyzed by immunoblotting using anti-TAP and anti-actin (loading control). The proteins are listed according to NAT affiliation and the catalytic subunit is shown at the top. The protein level of each NAT subunit relative to actin at each time point were quantified by densitometry analysis and normalized to the value at 6 h.

