Fig. 3.
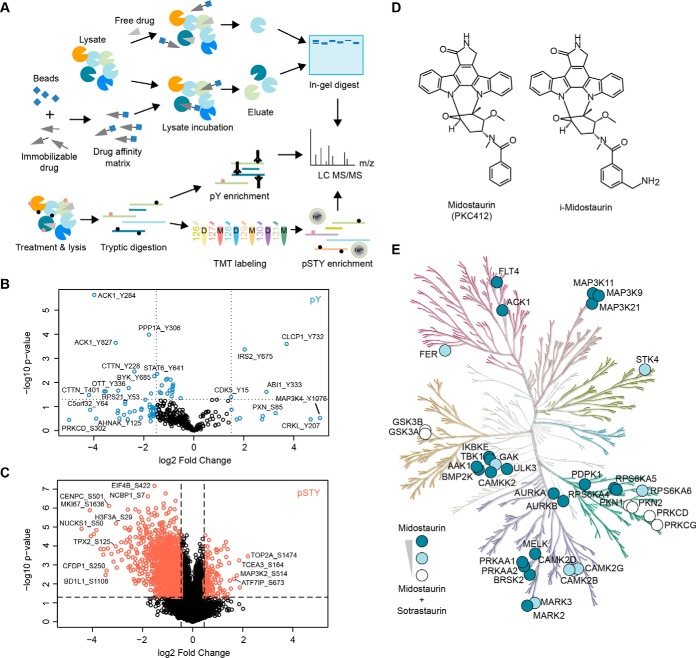
Layered functional proteomics strategy to elucidate midostaurin's MoA in A427 NSCLC cells. A, Mass spectrometry-enabled combination of direct target identification via affinity-based chemical proteomics (label-free) and midostaurin-induced signaling changes via global (TMT 6-plex) and tyrosine (label-free) phosphoproteomics. B, Volcano plot of all identified phosphopeptides of the pY dataset, displaying log2 fold change and p value. Peptides selected for network analysis are marked in blue. C, Volcano plot of all identified phosphopeptides in the global phosphoproteomics dataset, displaying log2 fold change and p value. Peptides selected for network analysis are marked in coral/red. D, Chemical structures of midostaurin and its immobilizable analogue i-midostaurin. E, Kinome tree of midostaurin's direct kinase targets. Color intensity indicates specific targets of midostaurin (dark blue) and targets shared between midostaurin and sotrastaurin (partial overlap: light blue; strong overlap: white). Kinome phylogenetic tree adapted courtesy of Cell Signaling Technology, Inc. (www.cellsignal.com).

