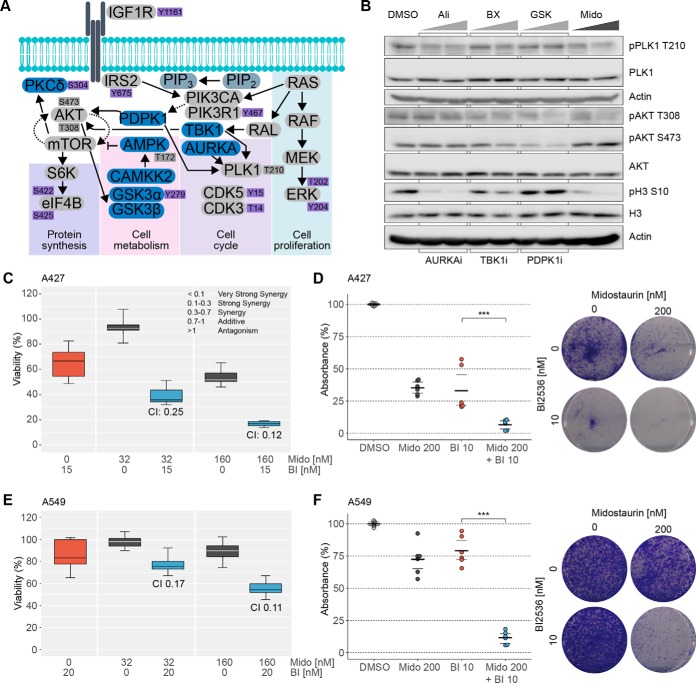
Fig. 6.
Rational design and validation of synergistic midostaurin drug combination. A, Condensed schematic of midostaurin's effector signaling network. Direct midostaurin targets are depicted in blue, MS-detected phosphosites in purple. Gray nodes complement the signaling network and were not detected via MS, dark gray phosphosites were validated by immunoblotting. B, Western blot analysis of downstream signaling nodes of critical midostaurin targets. A427 cells were treated for 3 h with 0.5 and 1 μm of alisertib (AURKAi), BX795 (TBK1i), GSK2334470 (PDPK1i) or midostaurin. Representative images of three biological replicates are shown. C/E, Viability of A427 (C) and A549 (E) cells upon midostaurin and the PLK1i BI2536 (C: 15 nm; E: 20 nm) treatment determined by CellTiterGlo. Data is representative of three biological replicates (mean ± S.D.). CI values were calculated using CompuSyn. D/F, Colony formation assay of A427 (D) and A549 (F) cells after 9 days of treatment with midostaurin and BI2536 at indicated concentrations. Data is representative of three biological replicates. Mido, midostaurin; BI, BI2536; DMSO: vehicle control.

