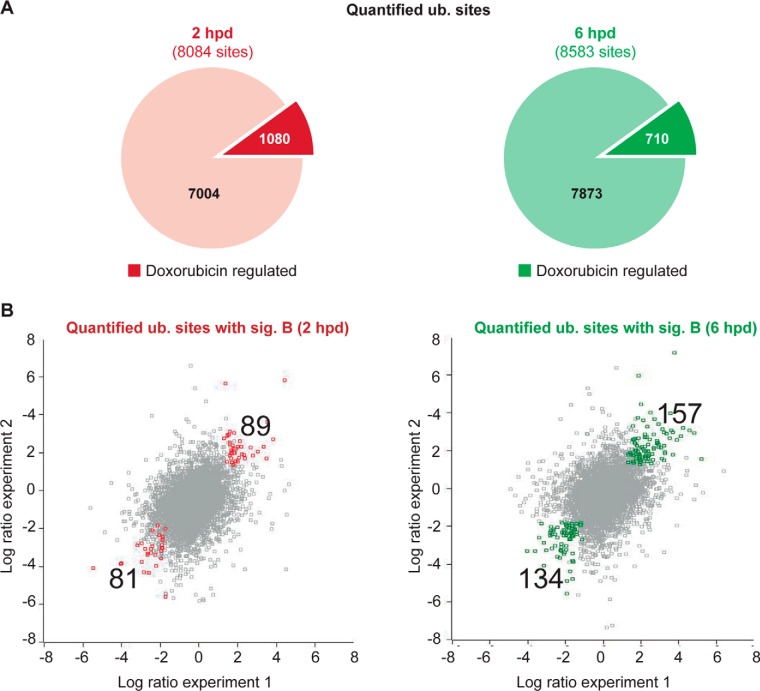
Fig. 2.
Ubiquitome data evaluation. (A) Pie charts showing the proportion of doxorubicin-regulated ubiquitin sites over the total number of quantified ubiquitin sites at each time point. The ubiquitin sites whose abundance increased or decreased at least twofold following doxorubicin treatment were considered doxorubicin-regulated. (B) Scatter plots represent the correlation of the log2 ratios of doxorubicin-regulated ubiquitin sites between the two independent experiments. Colored dots indicate sites that are significantly regulated in both experiments (p < 0.01, significant B test).

