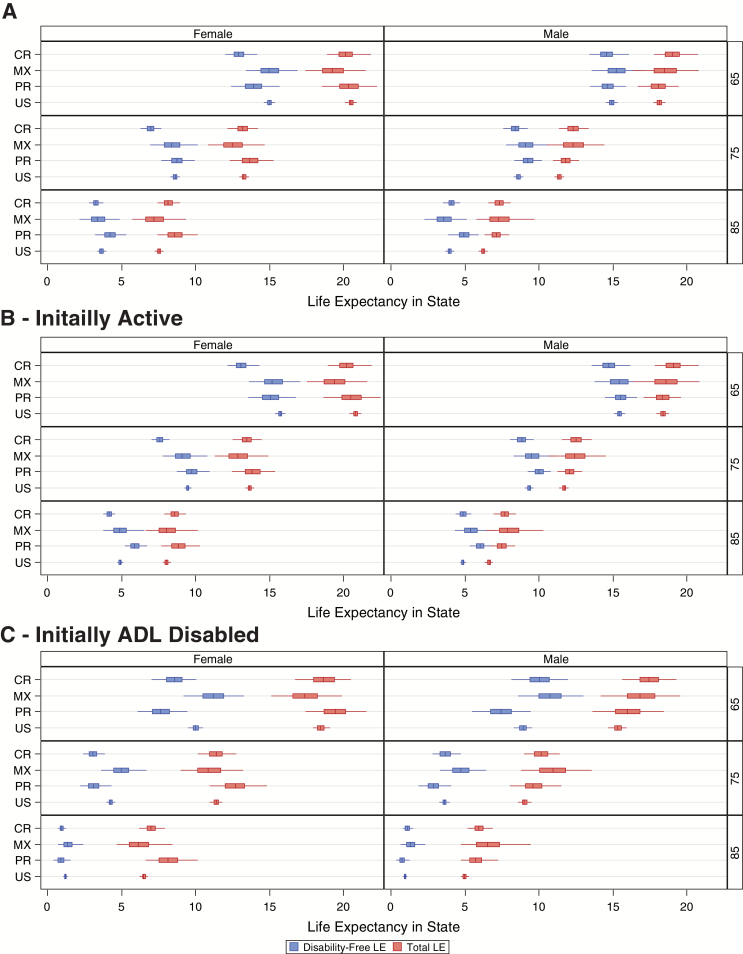
Figure 2.
Estimated total and disability-free life expectancy. This figure shows a comparison between the years an average individual will spend in remaining disability free and total life at ages 65, 75, and 85 by country. Lines represent the central 95% of the distribution of bootstrapped outcomes, and boxes span the first to third quartile of the outcome distribution with a vertical line at the median. Panel (A) presents the disability-free life expectancy (DFLE) and life expectancies of all individuals at ages 65, 75, and 85. Panels (B) and (C) present the DFLE and life expectancies of individuals who were initially active (B) and activities of daily living disabled (C) at ages 65, 75, and 85.

