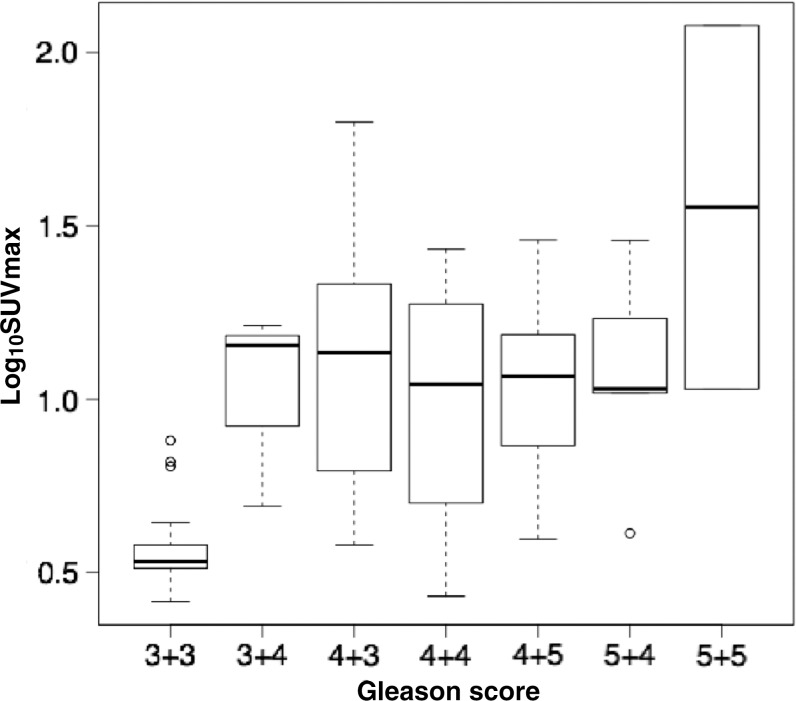
Figure 5:
Box plot depicts maximum tumor standardized uptake value (SUVmax), on a logarithmic scale, across various tumor Gleason scores. Vertical borders of box represent 25th and 75th percentiles, and middle bar represents median. Error bars represent first and 99th percentiles, and circles represent outliers. Generalized linear model demonstrated an association between SUVmax and Gleason score of 7 or greater (odds ratio = 2.22 [95% confidence interval: 1.46, 3.35], P < .001).

