Figure 2:
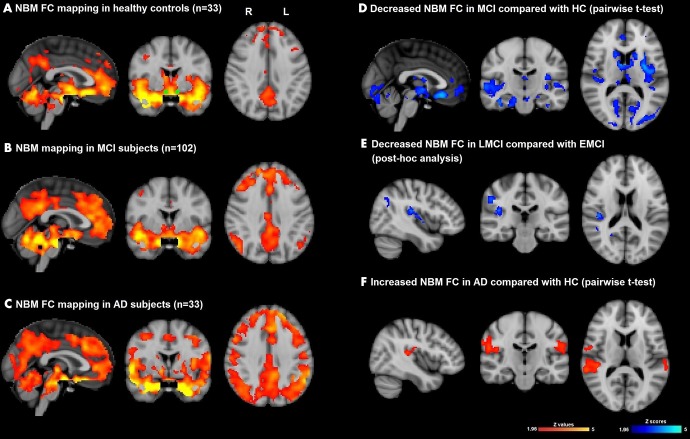
Images show functional connectivity (FC) mapping of nucleus basalis of Meynert (NBM) cholinergic network (hereafter, NBM FC) (whole cohort) in, A, healthy aging (healthy control participants [HC], n = 33; corrected P ˂ .05) and also shows seed mask (green), B, in patients with mild cognitive impairment (MCI) (n = 102; corrected P ˂ .05), and, C, in patients with Alzheimer disease (AD) (n = 33; corrected P ˂ .05). Significance was set at P ˂ .05. D, Difference NBM FC map between MCI and HC (blue-light blue indicates reductions in MCI; pairwise t test, corrected P ˂ .025). E, Difference NBM FC between late MCI (LMCI) and early MCI (EMCI) (blue-light blue indicates reductions in LMCI; posthoc pairwise t test, P ˂ .05). F, Difference NBM FC between AD and HC (red-yellow indicates increased FC in AD; pairwise t test, corrected P ˂ .025). All results were masked by gray matter masks obtained from Montreal Neurological Institute 152 standard-space T1-weighted average structural template image. All t test analyses were controlled for age and mean relative displacement.

