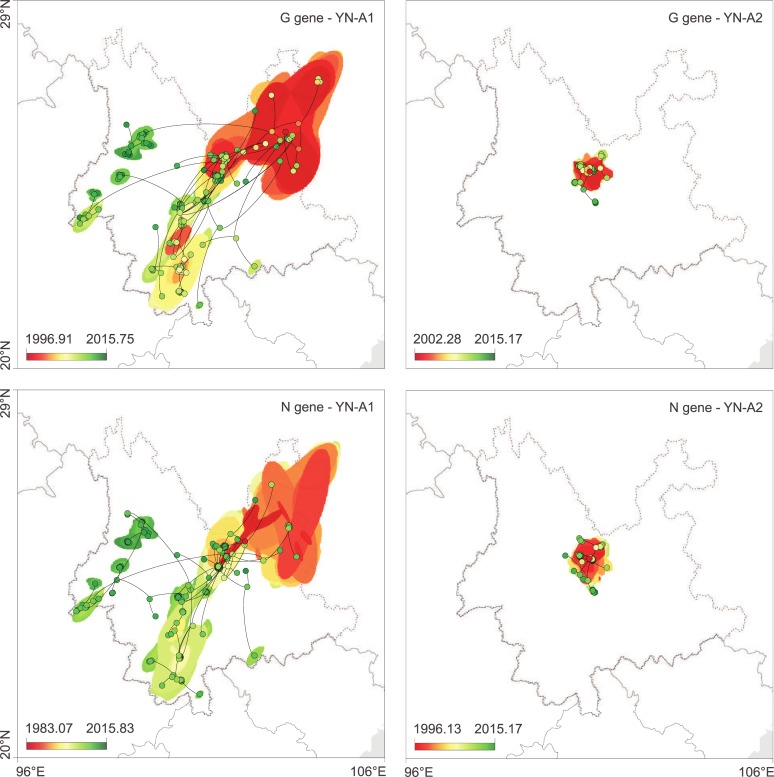
Fig 3. Spatiotemporal diffusion of Yunnan RABV clades estimated from continuous phylogeographic reconstructions.
The plots show mapped trees and 95% HPD regions based on 100 trees subsampled from the post burn-in posterior distribution of trees. Nodes of the trees are coloured according to a colour scale ranging from red (the time to the most recent common ancestor, TMRCA) to green (most recent sampling time). 95% HPD regions were computed for successive time layers and then superimposed using the same colour scale reflecting time. National and Yunnan Province borders are shown by solid and dashed lines, respectively.

