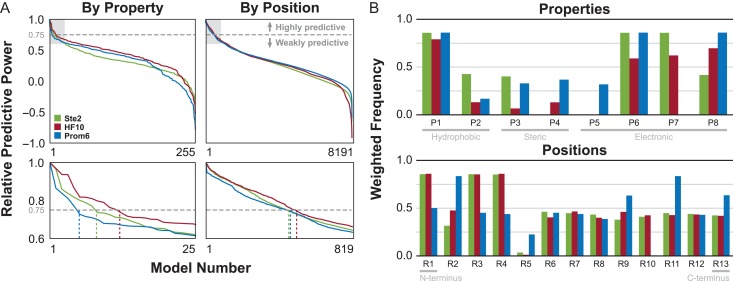
Fig. 3.
Characteristics of top-performing models. (A) Relative predictive power (sorted by Q2/Q2max) for each receptor/scheme pair for the top-performing response type. Dashed gray line indicates the selection threshold of Q2/Q2max = 0.75. Plots in the bottom row expand the light gray area of the corresponding top row, with dotted lines indicating the number of selected top models. (B) Weighted frequencies of each property (for the By Property grouping schemes) or position (for the By Position grouping schemes) in the selected top models for each receptor.

