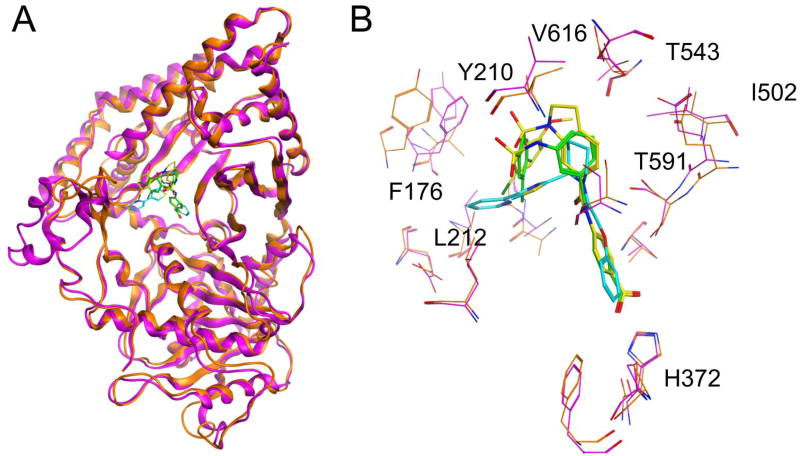
Figure 3.
(A) Molecular docking of inhibitors bound to T. muris CPT2 (orange) based on rat CPT2 2FW3 (magenta). (B) Overlay of 6a (cyan), 10a (green) and 17a (yellow). Residues of CPT2 homology model in T. muris are in orange and rat CPT2 is in magenta. Targeted differences in the CoA binding site of T. muris are shown as sticks. (i) Thr (rat), Val (Tm); (i) Phe (rat), Tyr (Tm); (iii) Lys (rat), Arg (Tm); (iv) Asn (rat), Thr (Tm).

