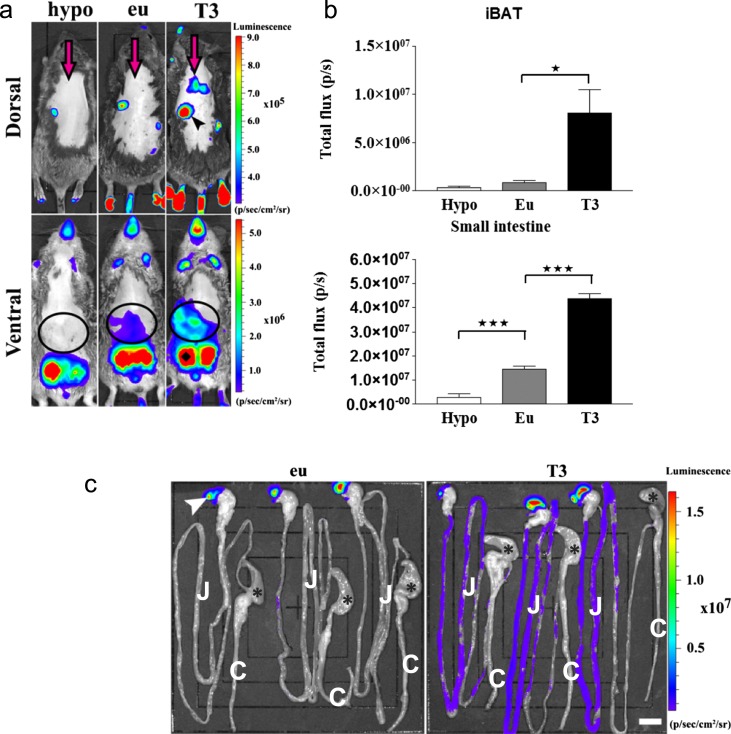
Figure 2.
Detection of TH action in live animals. (a) In vivo bioluminescence imaging on euthyroid, L-T3-treated (1 μg/g bw injected IP, 24 hours before imaging), and hypothyroid THAI #4 mice, followed by IP luciferin administration. Representative images of hypothyroid (hypo), euthyroid (eu), and L-T3-treated (T3) mice and light intensity diagram of iBAT and small intestine. T3 injection increased light intensity in iBAT. In the small intestine, hypothyroidism decreased, whereas T3 treatment increased light intensity. Dorsal image arrow: iBAT (arrowhead), saccus cecum of the stomach; ventral image (circles), small intestine; ♦, testicles. (b) Light intensity diagram of luciferase activity [photons/s (p/s)] in iBAT and small intestine of hypothyroid, euthyroid, and T3-treated THAI #4 mice. Means of p/s ± SEM (n = 3). *P < 0.05; ***P < 0.001 by one-way ANOVA, followed by Newman-Keuls post hoc test. (c) Bioluminescence of the gastrointestinal tract is confined to the small intestine. Imaging on an isolated gastrointestinal tract of three euthyroid and three L-T3-treated (1 μg/g bw injected IP, 24 hours before imaging) THAI #4 animals. T3-mediated light-intensity upregulation is mainly restricted to the small intestine, whereas the colon shows an order of magnitude lower luciferase activity. *, cecum; arrowhead, saccus cecum of the stomach. Original scale bar, 1 cm. C, colon; J, jejunum.

