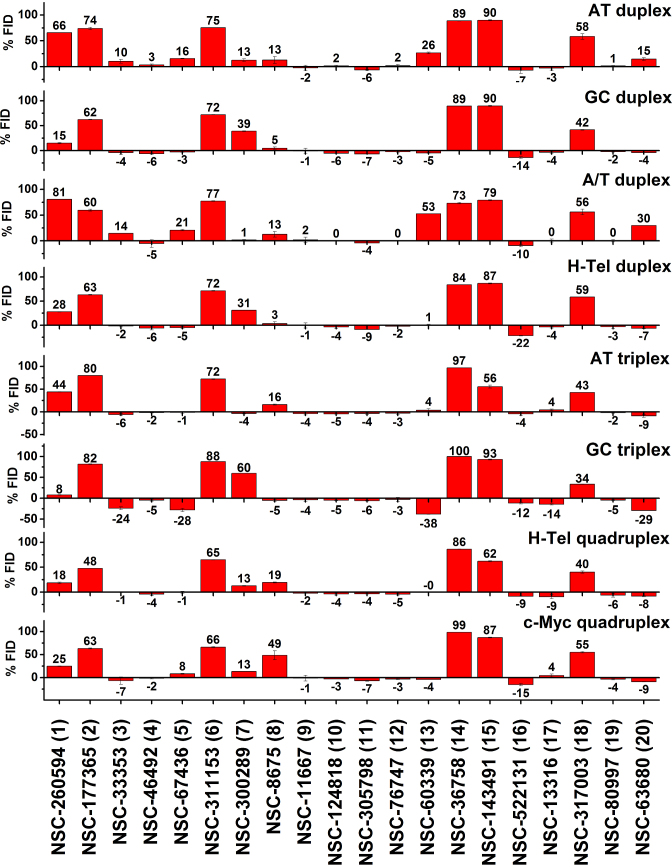
Figure 4.
Results of the FID assay for the 20 compounds with the highest Tm shift from the NCI diversity set III library and eight oligonucleotide structures. Each bar represents the %FID of a given compound for an oligonucleotide sequence. The error bars correspond to standard deviation of the %FID values from two different plate measurements.

