Figure 2.
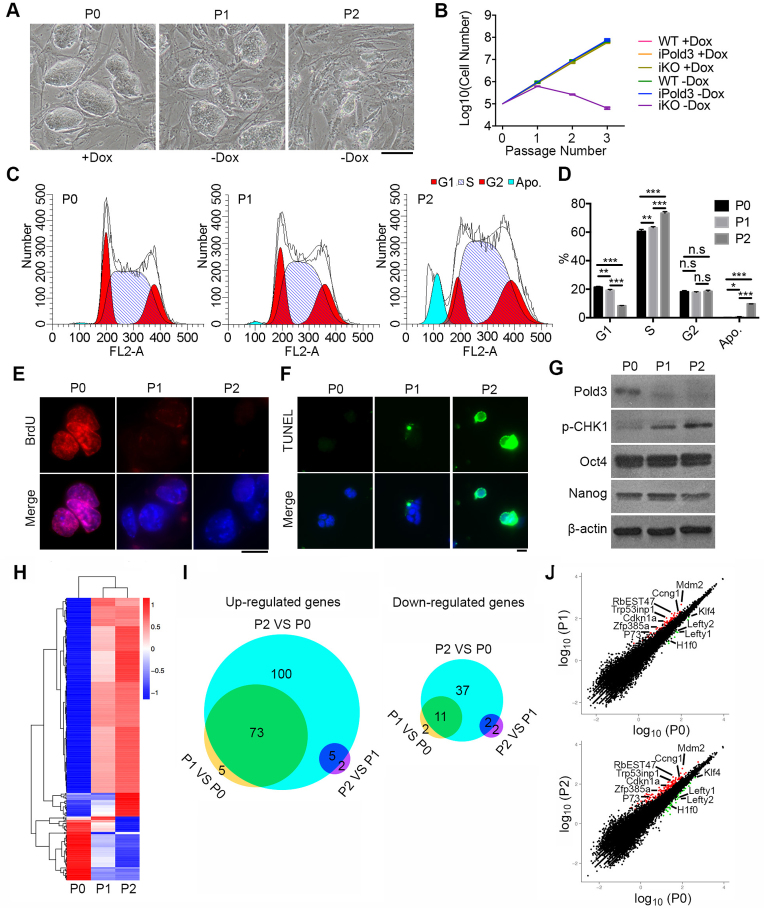
Cell cycle, apoptosis and RNA-seq analysis of Pold3 iKO ESCs. (A) Colony morphology of Pold3 iKO ESCs, cultured with Dox (P0), or without Dox for 48 h (P1) and for 96 h (P2). Scale bar, 100 μm. (B) Growth curve of WT, iPold3 (inducible exogenous Pold3 expression with endogenous Pold3) and iKO (inducible Pold3 knockout without endogenous Pold3) with or without Dox. (C and D) Cell cycle analysis of Pold3 iKO ESCs at P0, P1 and P2 by flow cytometry. Apo., apoptosis. Error bars indicate mean ± SEM (n = 3). *P < 0.05, **P < 0.01 and ***P < 0.001. (E) BrdU incorporation was detected in Pold3 iKO ESCs at P0, P1 and P2 by immunofluorescence. Scale bar, 20 μm. (F) TUNEL assay of apoptosis cells in Pold3 iKO ESCs at P0, P1 and P2. (G) Protein levels by western blot. (H) Heatmap cluster analysis of differentially regulated genes by RNA-seq analysis of Pold3 iKO ESCs. Pold3 iKO ESCs were cultured in the presence of Dox (P0) and 48 and 96 h after Dox withdrawal (P1 and P2, respectively). Differentially expressed genes were identified in these three comparisons with the criteria of more than 2-fold change and q-value < 0.005. (I) Venn diagram depicting the overlap of up- and downregulated genes among ESCs at P0, P1 and P2. (J) Scatterplot showing differentially expressed genes. Cell cycle, DNA repair and pluripotent associated genes are indicated.

