Figure 3.
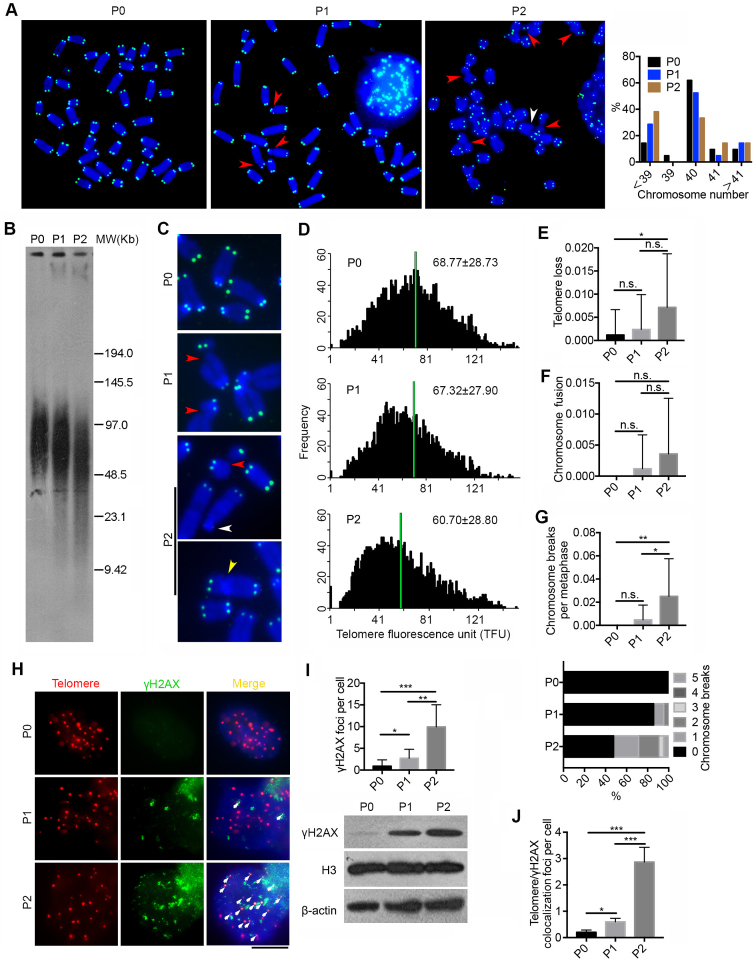
Deficiency of Pold3 leads to telomere loss and genomic instability in ESCs. (A) Representative telomere FISH images of Pold3 iKO ESCs. Green, telomeres, Blue, DAPI stained chromosome. Experiments were performed in Pold3 iKO ESCs with Dox (P0), or one passage (P1) or two passages (P2) after Dox withdrawal. Red arrowhead, chromosome break; White arrowhead, telomere loss. Right panel, Distribution in chromosome number of Pold3 iKO ESCs and ESCs at P0. About 20 chromosome spread was counted for each group. (B) Telomere length distribution shown as TRF by Southern blot analysis. (C) Enlarged telomere Q-FISH images, showing telomere loss (white arrowhead) and chromosome breakage (red arrowhead). Telomeres were labeled with telomere PNA probes (green), and chromosomes labeled with DAPI (blue). (D) Histogram showing distribution of relative telomere length as TFU by Q-FISH. Black bars on y axis indicate frequency of telomere signal-free ends. The medium telomere length (green bars) is shown as mean ± SD. About 20 chromosome spreads were quantified for each group. (E) Frequency of telomere loss per chromosome. (F) Frequency of chromosome fusion. (G) Frequency of chromosome breakage per chromosome. Bottom panel, Distribution of chromosome breaks in Pold3 iKO ESCs and ESCs at P0. About 20 chromosome spreads were counted for each group. (H) Immunofluorescence-FISH images of telomeres (red) and γH2AX (green). Co-localized foci are indicated by white arrows. Scale bar, 5 μm. (I) Statistical analysis of γH2AX foci per cell. Bottom panel, western blot analysis of γH2AX and H3 and β actin served as loading control. (J) Co-localized foci of telomeres and γH2AX per cell. 50 nuclei were randomly counted in (I) or (J). Data represent mean ± SEM. *P < 0.05; **P < 0.01; ***P < 0.001.

