Figure 6.
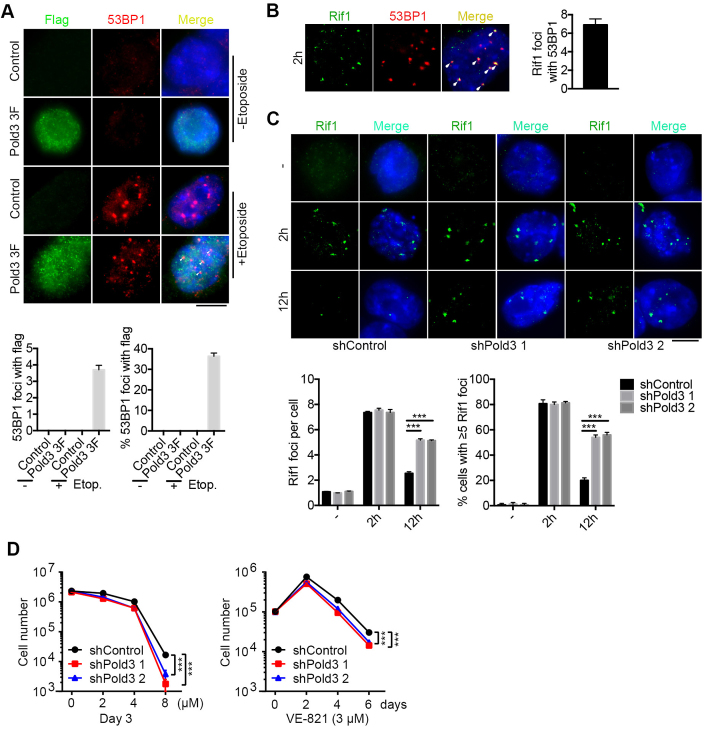
Involvement of 53BP1 and Rif1 in DNA damage repair by Pold3. (A) Immunofluorescence and quantification of Pold3 (Flag) and 53BP1 foci after treatment with etoposide for 2 h. 20 nuclei were randomly counted. (B) Co-localization of Rif1 and 53BP1 by immunofluorescence after exposure to 2.5 μM etoposide for 2 h. Right panel bar figure, 20 cells were counted. (C) Following exposure to 2.5 μM etoposide for 2 h, Pold3 KD (shPold3) ESCs (N33) exhibit more Rif1 foci by 12 h compared with shControl. Scale bar, 5 μm. n = 50 cells counted. (D) Increased sensitivity to ATR inhibitor in Pold3 KD (shPold3) ESCs than in shControl ESCs. ESCs were plated in 12-plates, and various concentrations of VE-821 were added in the culture medium, and number of cells counted at day 3. Alternatively, ESCs were plated in 12-plates, and 3 μM VE-821 was added in the medium. Cells were counted and replated into new plates every two days. Data were analyzed using Two-way ANOWA. Data represent mean ± SEM. ***P < 0.001.

